Question: This is the case study, which should be calculated in excel. The answer should be in Excel table format, thanks! July CASE STUDY Smartphone Production
This is the case study, which should be calculated in excel. The answer should be in Excel table format, thanks!
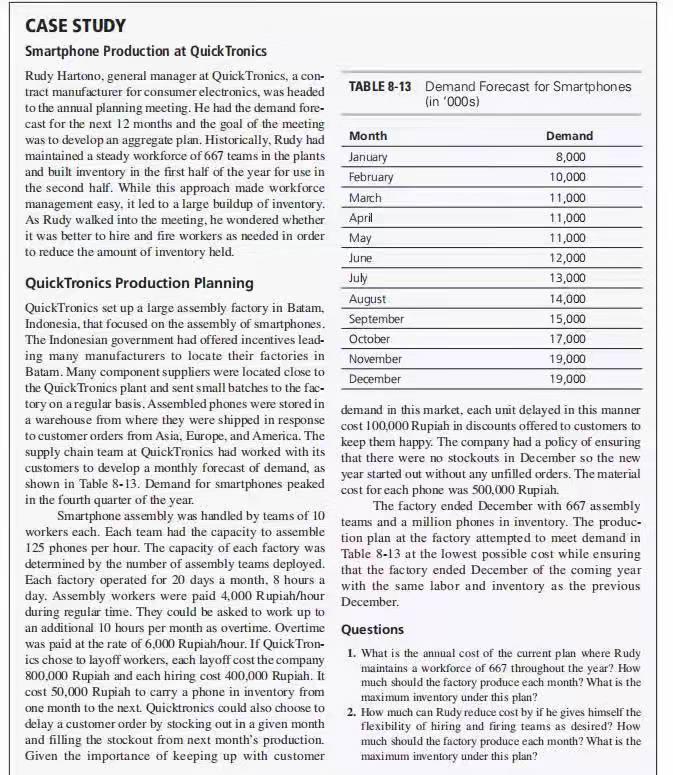
July CASE STUDY Smartphone Production at QuickTronics Rudy Hartono, general manager at QuickTronics, a con- tract manufacturer for consumer electronics, was headed TABLE 8-13 Demand Forecast for Smartphones to the annual planning meeting. He had the demand fore- (in '000s) cast for the next 12 months and the goal of the meeting was to develop an aggregate plan. Historically, Rudy had Month Demand maintained a steady workforce of 667 teams in the plants January 8,000 and built inventory in the first half of the year for use in February 10,000 the second half. While this approach made workforce March 11,000 management easy, it led to a large buildup of inventory. As Rudy walked into the meeting, he wondered whether April 11,000 it was better to hire and fire workers as needed in order May 11,000 to reduce the amount of inventory held. June 12,000 QuickTronics Production Planning 13,000 August 14,000 QuickTronics set up a large assembly factory in Batam, Indonesia, that focused on the assembly of smartphones. September 15,000 The Indonesian government had offered incentives lead October 17,000 ing many manufacturers to locate their factories in November 19,000 Batam. Many component suppliers were located close to December 19,000 the QuickTronics plant and sent small batches to the fac- tory on a regular basis. Assembled phones were stored in demand in this market, each unit delayed in this manner a warehouse from where they were shipped in response cost 100,000 Rupiah in discounts offered to customers to to customer orders from Asia, Europe and America. The keep them happy. The company had a policy of ensuring supply chain team at QuickTronics had worked with its that there were no stockouts in December so the new customers to develop a monthly forecast of demand as year started out without any unfilled orders. The material shown in Table 8-13. Demand for smartphones peaked cost for each phone was 500,000 Rupiah. in the fourth quarter of the year. The factory ended December with 667 assembly Smartphone assembly was handled by teams of 10 teams and a million phones in inventory. The produc- workers each. Each team had the capacity to assemble tion plan at the factory attempted to meet demand in 125 phones per hour. The capacity of each factory was Table 8-13 at the lowest possible cost while ensuring determined by the number of assembly teams deployed that the factory ended December of the coming year Each factory operated for 20 days a month. 8 hours a with the same labor and inventory as the previous day. Assembly workers were paid 4,000 Rupiah/hour December during regular time. They could be asked to work up to an additional 10 hours per month as overtime. Overtime Questions was paid at the rate of 6,000 Rupiah/hour. If Quick Tron- ics chose to layoff workers, each layoff cost the company 1. What is the annual cost of the current plan where Rudy maintains a workforce of 667 throughout the year'? How 800,000 Rupiah and each hiring cost 400,000 Rupiah. It much should the factory produce each month? What is the cost 50,000 Rupiah to carry a phone in inventory from maximum inventory under this plan? one month to the next Quicktronics could also choose to 2. How much can Rudy reduce cost by if he gives himself the delay a customer order by stocking out in a given month flexibility of hiring and firing teams as desired? How and filling the stockout from next month's production. much should the factory produce each month? What is the Given the importance of keeping up with customer maximum inventory under this plan? Ch8 Case Study: Smartphone Production at QuickTronics The report can be written in the style of an executive summary (1-2 pages) plus all the detailed calculations or supporting materials. Be to the point and try to imagine yourself to present the result in front of senior managers. Each team will submit the report as well as an appendix via Blackboard. Each team also needs to submit the report (hard copy) in class when the case is due. We may survey peer evaluations around the end of the course to ensure the equal participation of all the team members


