

Question: PLEASE SHOW ME STEP BY STEP YOUR EXCEL WORK!!!!!!!!! CASE STUDY Smartphone Production at QuickTronics Rudy Hartono, general manager at QuickTronics, a con- tract manufacturer
PLEASE SHOW ME STEP BY STEP YOUR EXCEL WORK!!!!!!!!!
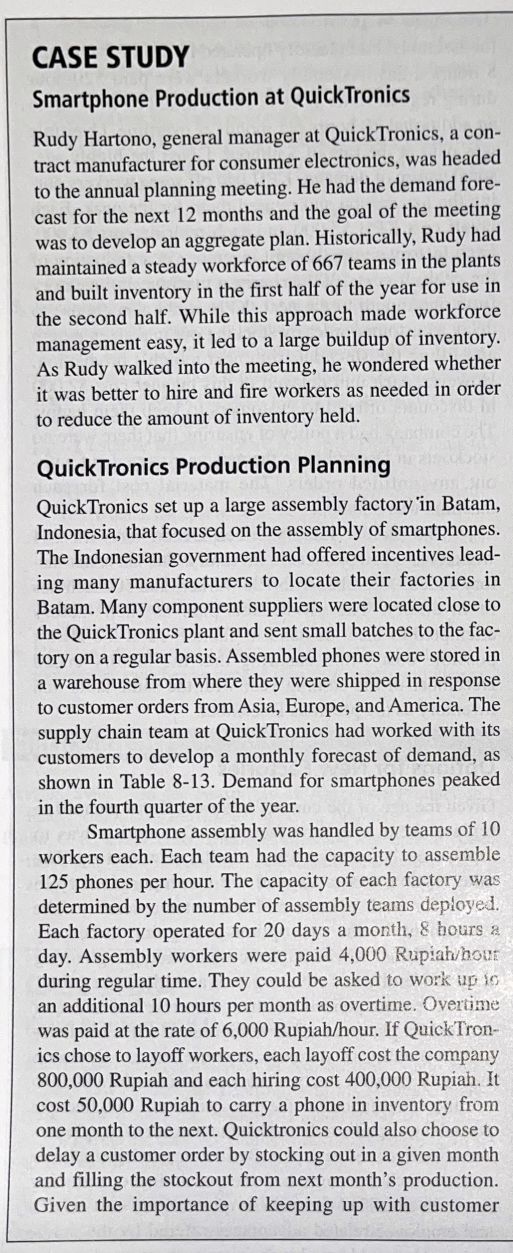
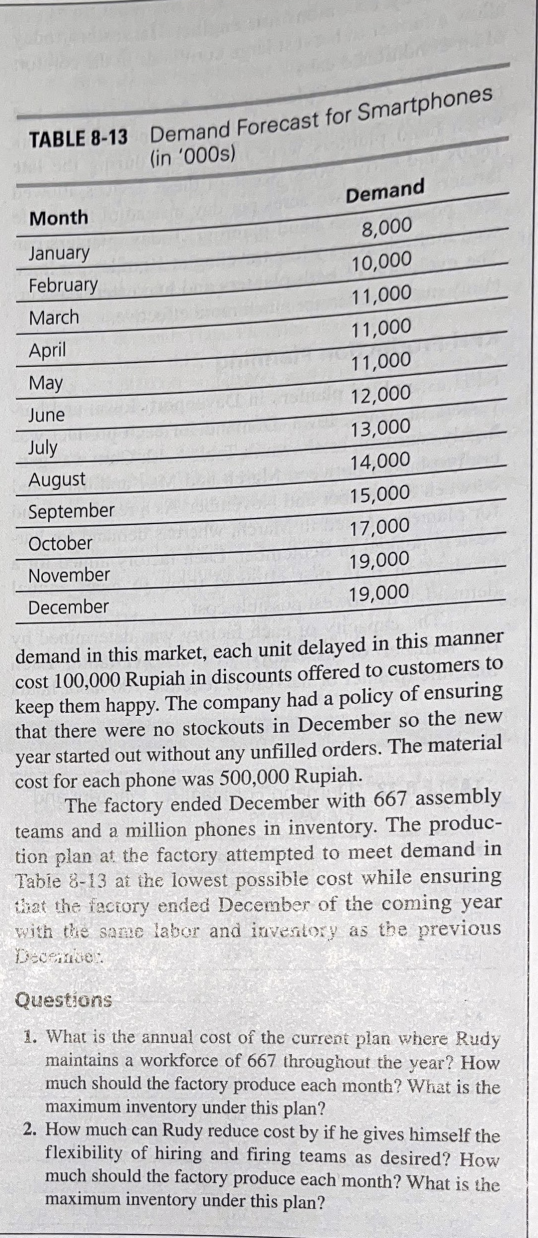
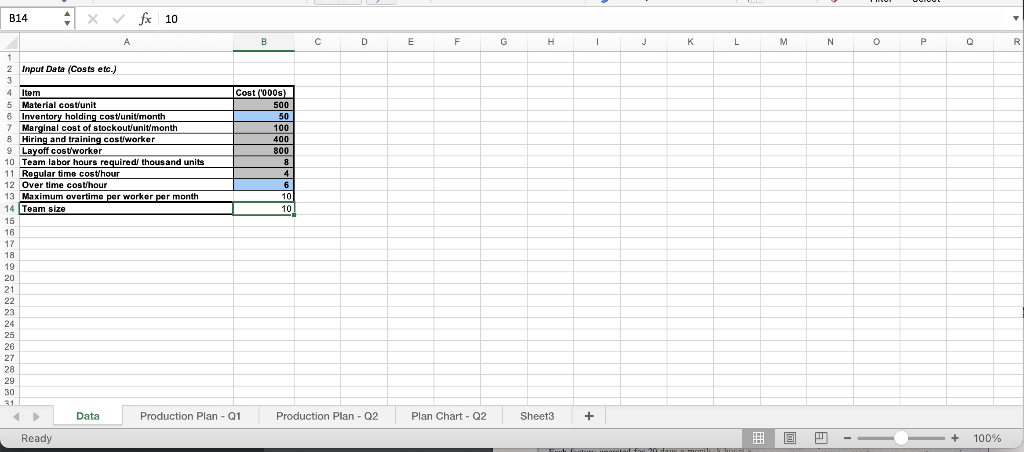
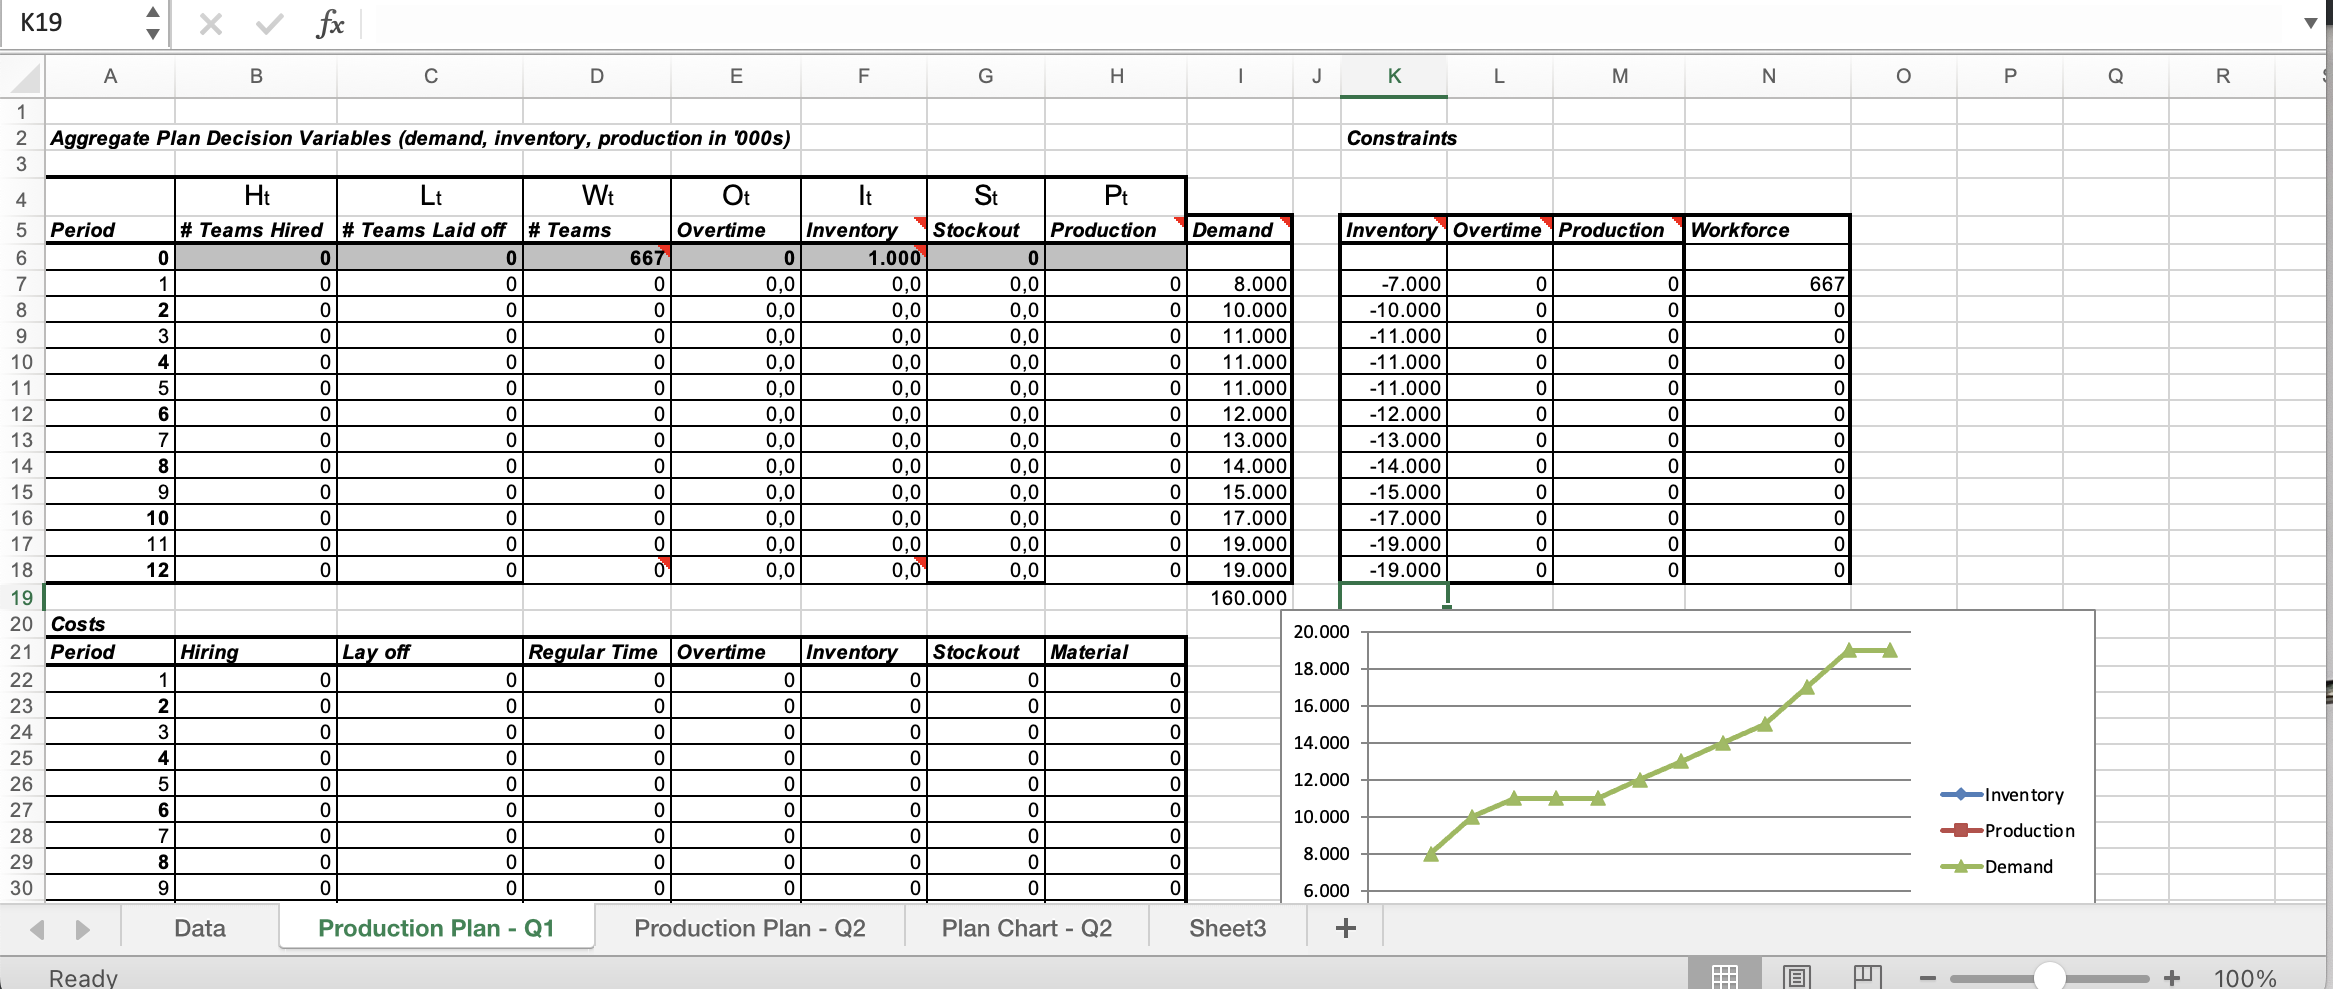
CASE STUDY Smartphone Production at QuickTronics Rudy Hartono, general manager at QuickTronics, a con- tract manufacturer for consumer electronics, was headed to the annual planning meeting. He had the demand fore- cast for the next 12 months and the goal of the meeting was to develop an aggregate plan. Historically, Rudy had maintained a steady workforce of 667 teams in the plants and built inventory in the first half of the year for use in the second half. While this approach made workforce management easy, it led to a large buildup of inventory. As Rudy walked into the meeting, he wondered whether it was better to hire and fire workers as needed in order to reduce the amount of inventory held. QuickTronics Production Planning QuickTronics set up a large assembly factory in Batam, Indonesia, that focused on the assembly of smartphones. The Indonesian government had offered incentives lead- ing many manufacturers to locate their factories in Batam. Many component suppliers were located close to the QuickTronics plant and sent small batches to the fac- tory on a regular basis. Assembled phones were stored in a warehouse from where they were shipped in response to customer orders from Asia, Europe, and America. The supply chain team at QuickTronics had worked with its customers to develop a monthly forecast of demand, as shown in Table 8-13. Demand for smartphones peaked in the fourth quarter of the year. Smartphone assembly was handled by teams of 10 workers each. Each team had the capacity to assemble 125 phones per hour. The capacity of each factory was determined by the number of assembly teams deployed. Each factory operated for 20 days a month, & hours a day. Assembly workers were paid 4,000 Rupiah/hour during regular time. They could be asked to work up ic an additional 10 hours per month as overtime. Overtime was paid at the rate of 6,000 Rupiah/hour. If Quick Tron- ics chose to layoff workers, each layoff cost the company 800,000 Rupiah and each hiring cost 400,000 Rupiah. It cost 50,000 Rupiah to carry a phone in inventory from one month to the next. Quicktronics could also choose to delay a customer order by stocking out in a given month and filling the stockout from next month's production. Given the importance of keeping up with customer TABLE 8-13 Demand Forecast for Smartphones (in '000s) Month January February March April May June July August September October November December Demand 8,000 10,000 11,000 11,000 11,000 12,000 13,000 14,000 15,000 17,000 19,000 19,000 demand in this market, each unit delayed in this manner cost 100,000 Rupiah in discounts offered to customers to keep them happy. The company had a policy of ensuring that there were no stockouts in December so the new year started out without any unfilled orders. The material cost for each phone was 500,000 Rupiah. The factory ended December with 667 assembly teams and a million phones in inventory. The produc- tion plan at the factory attempted to meet demand in Table 8-13 at the lowest possible cost while ensuring that the factory ended December of the coming year with the same labor and inventory as the previous December Questions 1. What is the annual cost of the current plan where Rudy maintains a workforce of 667 throughout the year? How much should the factory produce each month? What is the maximum inventory under this plan? 2. How much can Rudy reduce cost by if he gives himself the flexibility of hiring and firing teams as desired? How much should the factory produce each month? What is the maximum inventory under this plan? B14 1 2 Input Data (Costs etc.) 4 Item 5 Material cost/unit 6 Inventory holding cost/unit/month 7 Marginal cost of stockout/unit/month 8 Hiring and training cost/worker 9 Layoff cost/worker 10 Team labor hours required/ thousand units 11 Regular time cost/hour 12 Over time cost/hour 13 Maximum overtime per worker per month 14 Team size 15 16 17 18 19 20 21 22 23 + X fx 10 A 24 25 26 27 28 29 30 31 Ready Data B Cost (000s) 500 50 100 400 800 8 Production Plan - Q1 4 6 10 10 D Production Plan - Q2 E F Plan Chart - Q2 G H Sheet3 I + Book fonto J K rored for 20 dour a month. 1 L # M 3 N 0 P + Q 100% R K19 4 5 6 7 8 A 9 10 11 12 13 14 15 16 17 18 Period 19 20 Costs 21 Period 22 23 24 25 26 27 28 29 30 Ready 1 2 Aggregate Plan Decision Variables (demand, inventory, production in '000s) 3 0 1 2 3 4 5 6 7 8 9 10 11 12 X 1 2 3 4 5 6 7 8 9 B Hiring fx Data Ht Lt Wt # Teams Hired # Teams Laid off # Teams 0 0 0 0 0 0 0 0 0 0 0 0 0 0 0 0 0 0 0 0 0 0 0 0 0 0 C Lay off 0 0 0 0 0 0 0 0 0 D 0 0 0 0 0 0 0 0 0 Production Plan - Q1 667 0 0 0 0 0 0 0 0 0 0 0 0 Regular Time 0 0 0 E 0 0 0 0 0 0 Ot Overtime Overtime 0 0,0 0,0 0,0 0,0 0,0 0,0 0,0 0,0 0,0 0,0 0,0 0,0 F It Inventory 0 0 0 0 0 0 0 0 0 Production Plan - Q2 1.000 0,0 0,0 0,0 0,0 0,0 0,0 0,0 0,0 0,0 0,0 0,0 0,0 Inventory 0 0 0 0 0 0 0 0 0 G St Stockout 0 0,0 0,0 0,0 0,0 0,0 0,0 0,0 0,0 0,0 0,0 0,0 0,0 Stockout H Pt Production Material 0 0 0 0 0 0 0 0 0 Plan Chart - Q2 0 0 I 0 0 0 0 0 0 0 8.000 10.000 11.000 11.000 11.000 12.000 13.000 14.000 0 15.000 0 17.000 0 19.000 19.000 160.000 0 0 0 0 0 0 0 0 0 Demand Sheet3 J Constraints 20.000 18.000 16.000 14.000 12.000 K 10.000 Inventory Overtime Production 8.000 6.000 L -7.000 -10.000 -11.000 -11.000 -11.000 -12.000 -13.000 -14.000 -15.000 -17.000 -19.000 -19.000 0 0 0 0 0 0 0 0 0 0 M 0 0 0 0 0 0 0 0 0 0 0 0 0 0 N Workforce 667 0 0 0 0 0 0 0 0 0 0 0 O P Inventory -Production -Demand Q + R 100%Step by Step Solution
There are 3 Steps involved in it
1 Expert Approved Answer
Step: 1 Unlock

Question Has Been Solved by an Expert!
Get step-by-step solutions from verified subject matter experts
Step: 2 Unlock
Step: 3 Unlock