

Question: This is the chart. Values are as follows: 1 0 2 0 3 0 9 V 1 5 A 2 3 2 6 4 0
This is the chart. Values are as follows:
V A
V A
V A
Please help with the following questions based on this info. Thank you Table
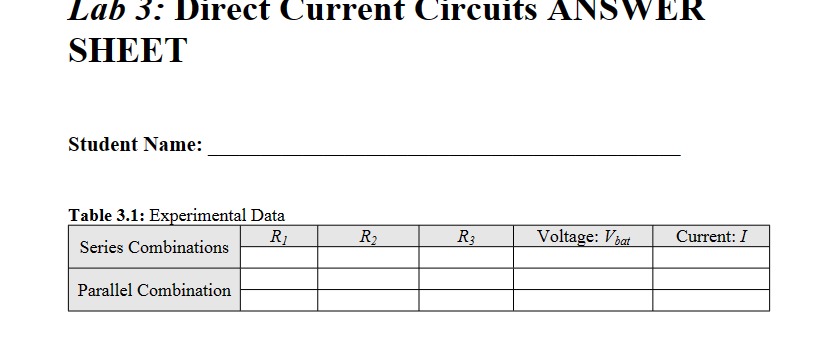
: Experimental Data
Series Combinations R
R
R
Voltage: Vbat Current: I
V
A
Parallel Combination
V
A
V
A
Analysis
Series Combinations
Effective resistance
expected value
Effective resistance
experimental value
What is the percentage difference?
Parallel Combinations
Effective resistance
expected value
Effective resistance
experimental value
What is the percentage difference?
Conclusions
Series Combinations
Insert screenshot of your series combination setup.
Write a conclusion based on your observations. Does the series combination formula hold?
Parallel Combinations
Insert screenshot of your parallel combination setup.
Write a conclusion based on your observations. Does the parallel combination formula hold?
Step by Step Solution
There are 3 Steps involved in it
1 Expert Approved Answer
Step: 1 Unlock

Question Has Been Solved by an Expert!
Get step-by-step solutions from verified subject matter experts
Step: 2 Unlock
Step: 3 Unlock