

Question: this is the code for plotting a ecg and the peaks but i need another code for finding the heart rate. BREAKPOINTS RUN Hitor -
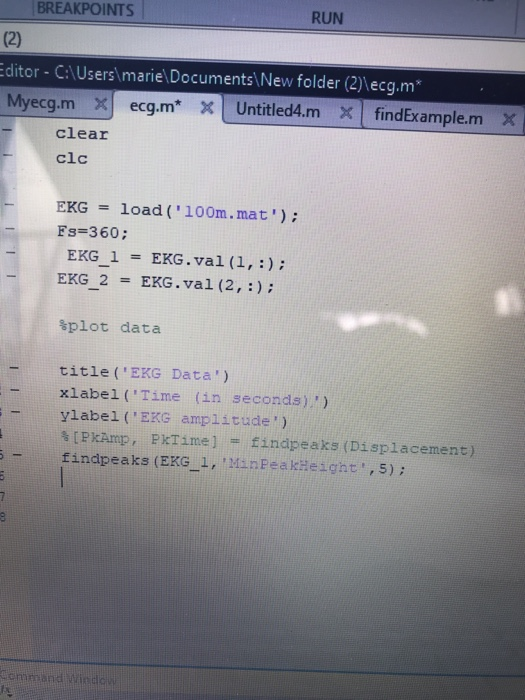
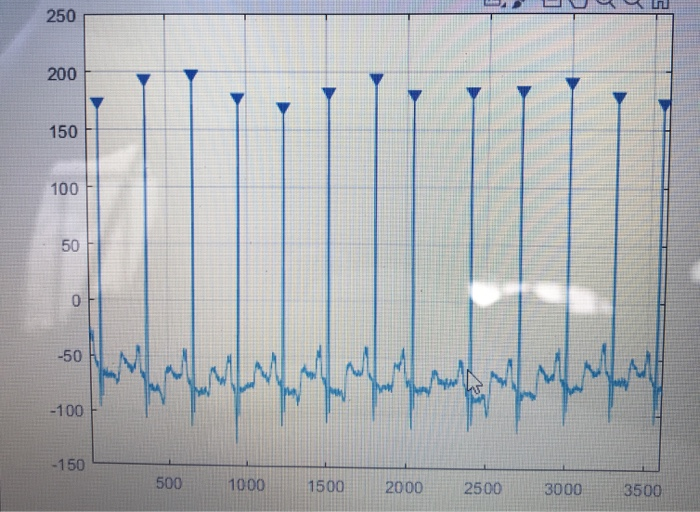
BREAKPOINTS RUN Hitor - C:\Users\marie Documents\New folder (2) ecg.m Myecg.m x ecg.m* X Untitled4.m x findExample.m clear X clc EKG = load('100m.mat'); Fg=360; EKG 1 = EKG.val (1,:); EKG_2 = EKG.val(2,:); Splot data title('EKG Data') xlabel('Time (in seconds) ylabel('EKG amplitude') [PkAmp, PkTime] = findpeaks (Displacement) findpeaks (EKG_1, MinPeakHeight',5); ommand Window 250 200 150 100 50 -50 -100 -150 500 1000 1500 2000 2500 3000 3500 BREAKPOINTS RUN Hitor - C:\Users\marie Documents\New folder (2) ecg.m Myecg.m x ecg.m* X Untitled4.m x findExample.m clear X clc EKG = load('100m.mat'); Fg=360; EKG 1 = EKG.val (1,:); EKG_2 = EKG.val(2,:); Splot data title('EKG Data') xlabel('Time (in seconds) ylabel('EKG amplitude') [PkAmp, PkTime] = findpeaks (Displacement) findpeaks (EKG_1, MinPeakHeight',5); ommand Window 250 200 150 100 50 -50 -100 -150 500 1000 1500 2000 2500 3000 3500
Step by Step Solution
There are 3 Steps involved in it

Get step-by-step solutions from verified subject matter experts