

Question: This is the dataset for this project, and must applied to this project. It should be as a csv file. NOTE: The last time I
This is the dataset for this project, and must applied to this project. It should be as a csv file.
NOTE: The last time I uploaded the code were giving errors. One of the example of the error seaborn library sns.heatmap(df.corr(), annot = True) and the correlation of csv file df.corr output was like OUT: _ (like a underscore, there wasn't any correlation distributed in THE CODE).
I WANT TO GET TRUE WORKING CODES LIKE WITHOUT ANY ERRORS.
PLEASE APPLY ALL THE INSTRUCTIONS IN THE GIVEN FILE AND USE DATA'S IN THE DATASET THAT I HAVE GIVEN.
Thanks,
Regards!
Location,Time,Hospital_Stay,MRI_Units,CT_Scanners,Hospital_Beds AUS,1992,6.6,1.43,16.71,1.43 AUS,1994,6.4,2.36,18.48,2.36 AUS,1995,6.5,2.89,20.55,2.89 AUS,1996,6.4,2.96,21.95,2.96 AUS,1997,6.2,3.53,23.34,3.53 AUS,1998,6.1,4.51,24.18,4.51 AUS,1999,6.2,6.01,25.52,6.01 AUS,2000,6.1,3.52,26.28,3.52 AUS,2001,6.2,3.79,29.05,3.79 AUS,2002,6.2,3.74,34.37,3.74 AUS,2003,6.1,3.7,40.57,3.7 AUS,2004,6.1,3.76,45.65,3.76 AUS,2005,6.0,4.26,51.54,4.26 AUS,2006,5.9,4.89,56.72,4.89 AUS,2009,5.1,5.72,39.14,5.72 AUS,2010,5.0,5.67,43.07,5.67 AUS,2011,4.9,5.6,44.32,5.6 AUS,2012,4.8,5.5,50.5,5.5 AUS,2013,4.7,13.84,53.66,13.84 AUS,2014,4.7,14.65,56.06,14.65 AUS,2015,4.2,14.49,59.54,14.49 AUS,2016,4.2,14.3,63.0,14.3 AUS,2017,4.1,14.15,64.34,14.15 AUT,1996,9.5,7.54,24.25,7.54 AUT,1997,8.3,8.53,25.23,8.53 AUT,1998,8.2,8.52,26.08,8.52 AUT,1999,7.8,11.01,26.02,11.01 AUT,2000,7.6,10.98,26.09,10.98 AUT,2001,7.4,11.69,26.61,11.69 AUT,2002,7.3,13.36,27.1,13.36 AUT,2003,7.2,13.54,27.21,13.54 AUT,2004,7.2,15.91,29.25,15.91 AUT,2005,6.9,16.16,29.66,16.16 AUT,2006,6.9,16.81,29.87,16.81 AUT,2007,6.8,17.72,30.02,17.72 AUT,2008,6.8,18.03,29.68,18.03 AUT,2009,6.7,18.46,29.36,18.46 AUT,2010,6.6,18.65,29.89,18.65 AUT,2011,6.5,18.71,29.55,18.71 AUT,2012,6.5,19.1,29.77,19.1 AUT,2013,6.5,19.22,29.6,19.22 AUT,2014,6.5,19.66,29.37,19.66 AUT,2015,6.5,20.71,28.93,20.71 AUT,2016,6.4,22.43,29.07,22.43 AUT,2017,6.4,22.96,28.64,22.96 AUT,2018,6.3,23.53,28.84,23.53 BEL,2003,8.0,6.84,10.5,6.84 BEL,2004,7.9,7.0,11.23,7.0 BEL,2005,7.9,6.97,12.79,6.97 BEL,2006,7.8,7.11,12.51,7.11 BEL,2007,7.7,7.53,13.08,7.53 BEL,2008,7.4,10.36,13.91,10.36 BEL,2009,7.2,10.65,14.26,10.65 BEL,2010,7.2,10.65,13.95,10.65 BEL,2011,7.1,10.69,13.77,10.69 BEL,2012,7.0,10.62,15.04,10.62 BEL,2013,6.9,10.84,22.94,10.84 BEL,2014,6.9,11.78,21.77,11.78 BEL,2015,6.8,11.71,23.59,11.71 BEL,2016,6.7,11.65,23.92,11.65 BEL,2017,6.6,11.6,23.82,11.6 BEL,2018,6.6,11.64,23.89,11.64 CAN,1990,10.2,0.69,7.15,0.69 CAN,1991,10.0,0.78,7.13,0.78 CAN,1992,9.9,0.99,7.33,0.99 CAN,1993,9.8,1.05,7.53,1.05 CAN,1994,7.4,1.21,7.69,1.21 CAN,1995,7.2,1.37,7.99,1.37 CAN,1997,7.0,1.84,8.19,1.84 CAN,2001,7.3,4.19,9.77,4.19 CAN,2003,7.3,4.71,10.27,4.71 CAN,2004,7.3,4.92,10.68,4.92 CAN,2005,7.2,5.74,11.57,5.74 CAN,2006,7.4,6.17,12.04,6.17 CAN,2007,7.5,6.75,12.74,6.75 CAN,2009,7.7,7.91,13.8,7.91 CAN,2010,7.7,8.26,14.23,8.26 CAN,2011,7.6,8.53,14.62,8.53 CAN,2012,7.6,8.87,14.69,8.87 CAN,2013,7.5,8.89,14.77,8.89 CAN,2015,7.4,9.52,15.07,9.52 CAN,2017,7.4,10.02,15.35,10.02 CZE,1991,11.9,0.19,2.13,0.19 CZE,1992,11.6,0.39,4.65,0.39 CZE,1993,11.2,0.58,5.71,0.58 CZE,1994,10.8,0.68,6.19,0.68 CZE,1995,10.2,0.97,6.68,0.97 CZE,2000,7.9,1.66,9.65,1.66 CZE,2005,7.9,3.13,12.34,3.13 CZE,2007,7.0,4.37,12.91,4.37 CZE,2008,6.7,5.01,13.39,5.01 CZE,2009,6.7,5.74,14.17,5.74 CZE,2010,6.6,6.3,14.51,6.3 CZE,2011,6.4,6.86,14.77,6.86 CZE,2012,6.2,6.95,15.03,6.95 CZE,2013,6.0,7.42,15.03,7.42 CZE,2014,6.0,7.41,15.11,7.41 CZE,2015,5.9,8.34,16.12,8.34 CZE,2016,5.9,8.52,15.52,8.52 CZE,2017,5.8,9.44,15.76,9.44 CZE,2018,5.8,10.35,16.09,10.35
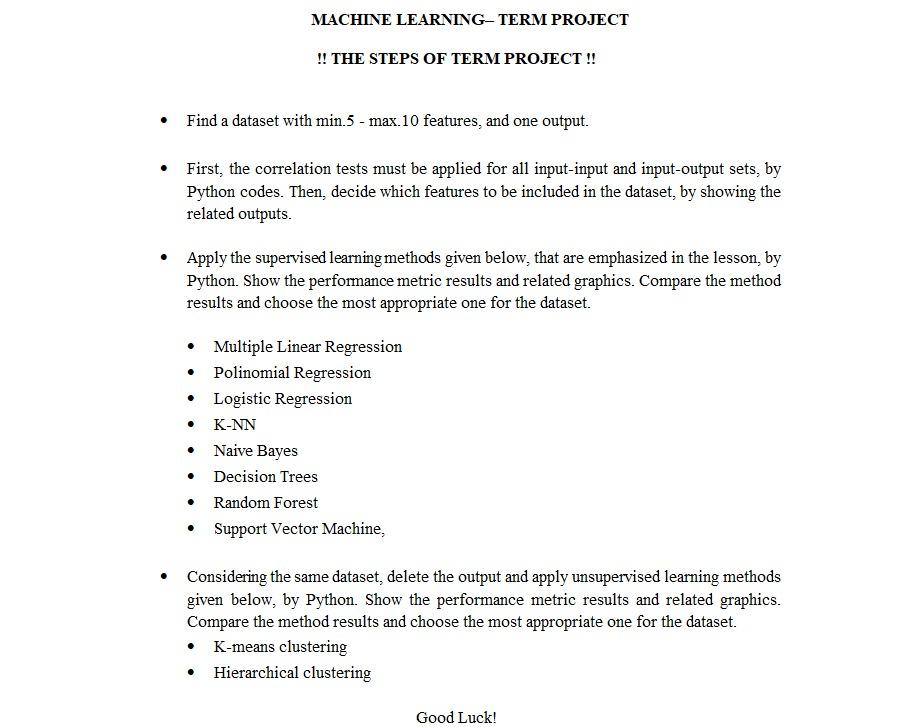
- First, the correlation tests must be applied for all input-input and input-output sets, by Python codes. Then, decide which features to be included in the dataset, by showing the related outputs. - Apply the supervised learning methods given below, that are emphasized in the lesson, by Python. Show the performance metric results and related graphics. Compare the method results and choose the most appropriate one for the dataset. - Multiple Linear Regression - Polinomial Regression - Logistic Regression - KNN - Naive Bayes - Decision Trees - Random Forest - Support Vector Machine, - Considering the same dataset, delete the output and apply unsupervised learning methods given below, by Python. Show the performance metric results and related graphics. Compare the method results and choose the most appropriate one for the dataset. - K-means clustering - Hierarchical clustering
Step by Step Solution
There are 3 Steps involved in it

Get step-by-step solutions from verified subject matter experts