

Question: This is the information I collected 111% v + A Format Document Zoom Add Page Insert Table Chart Text Shape Media Comment Share View Text
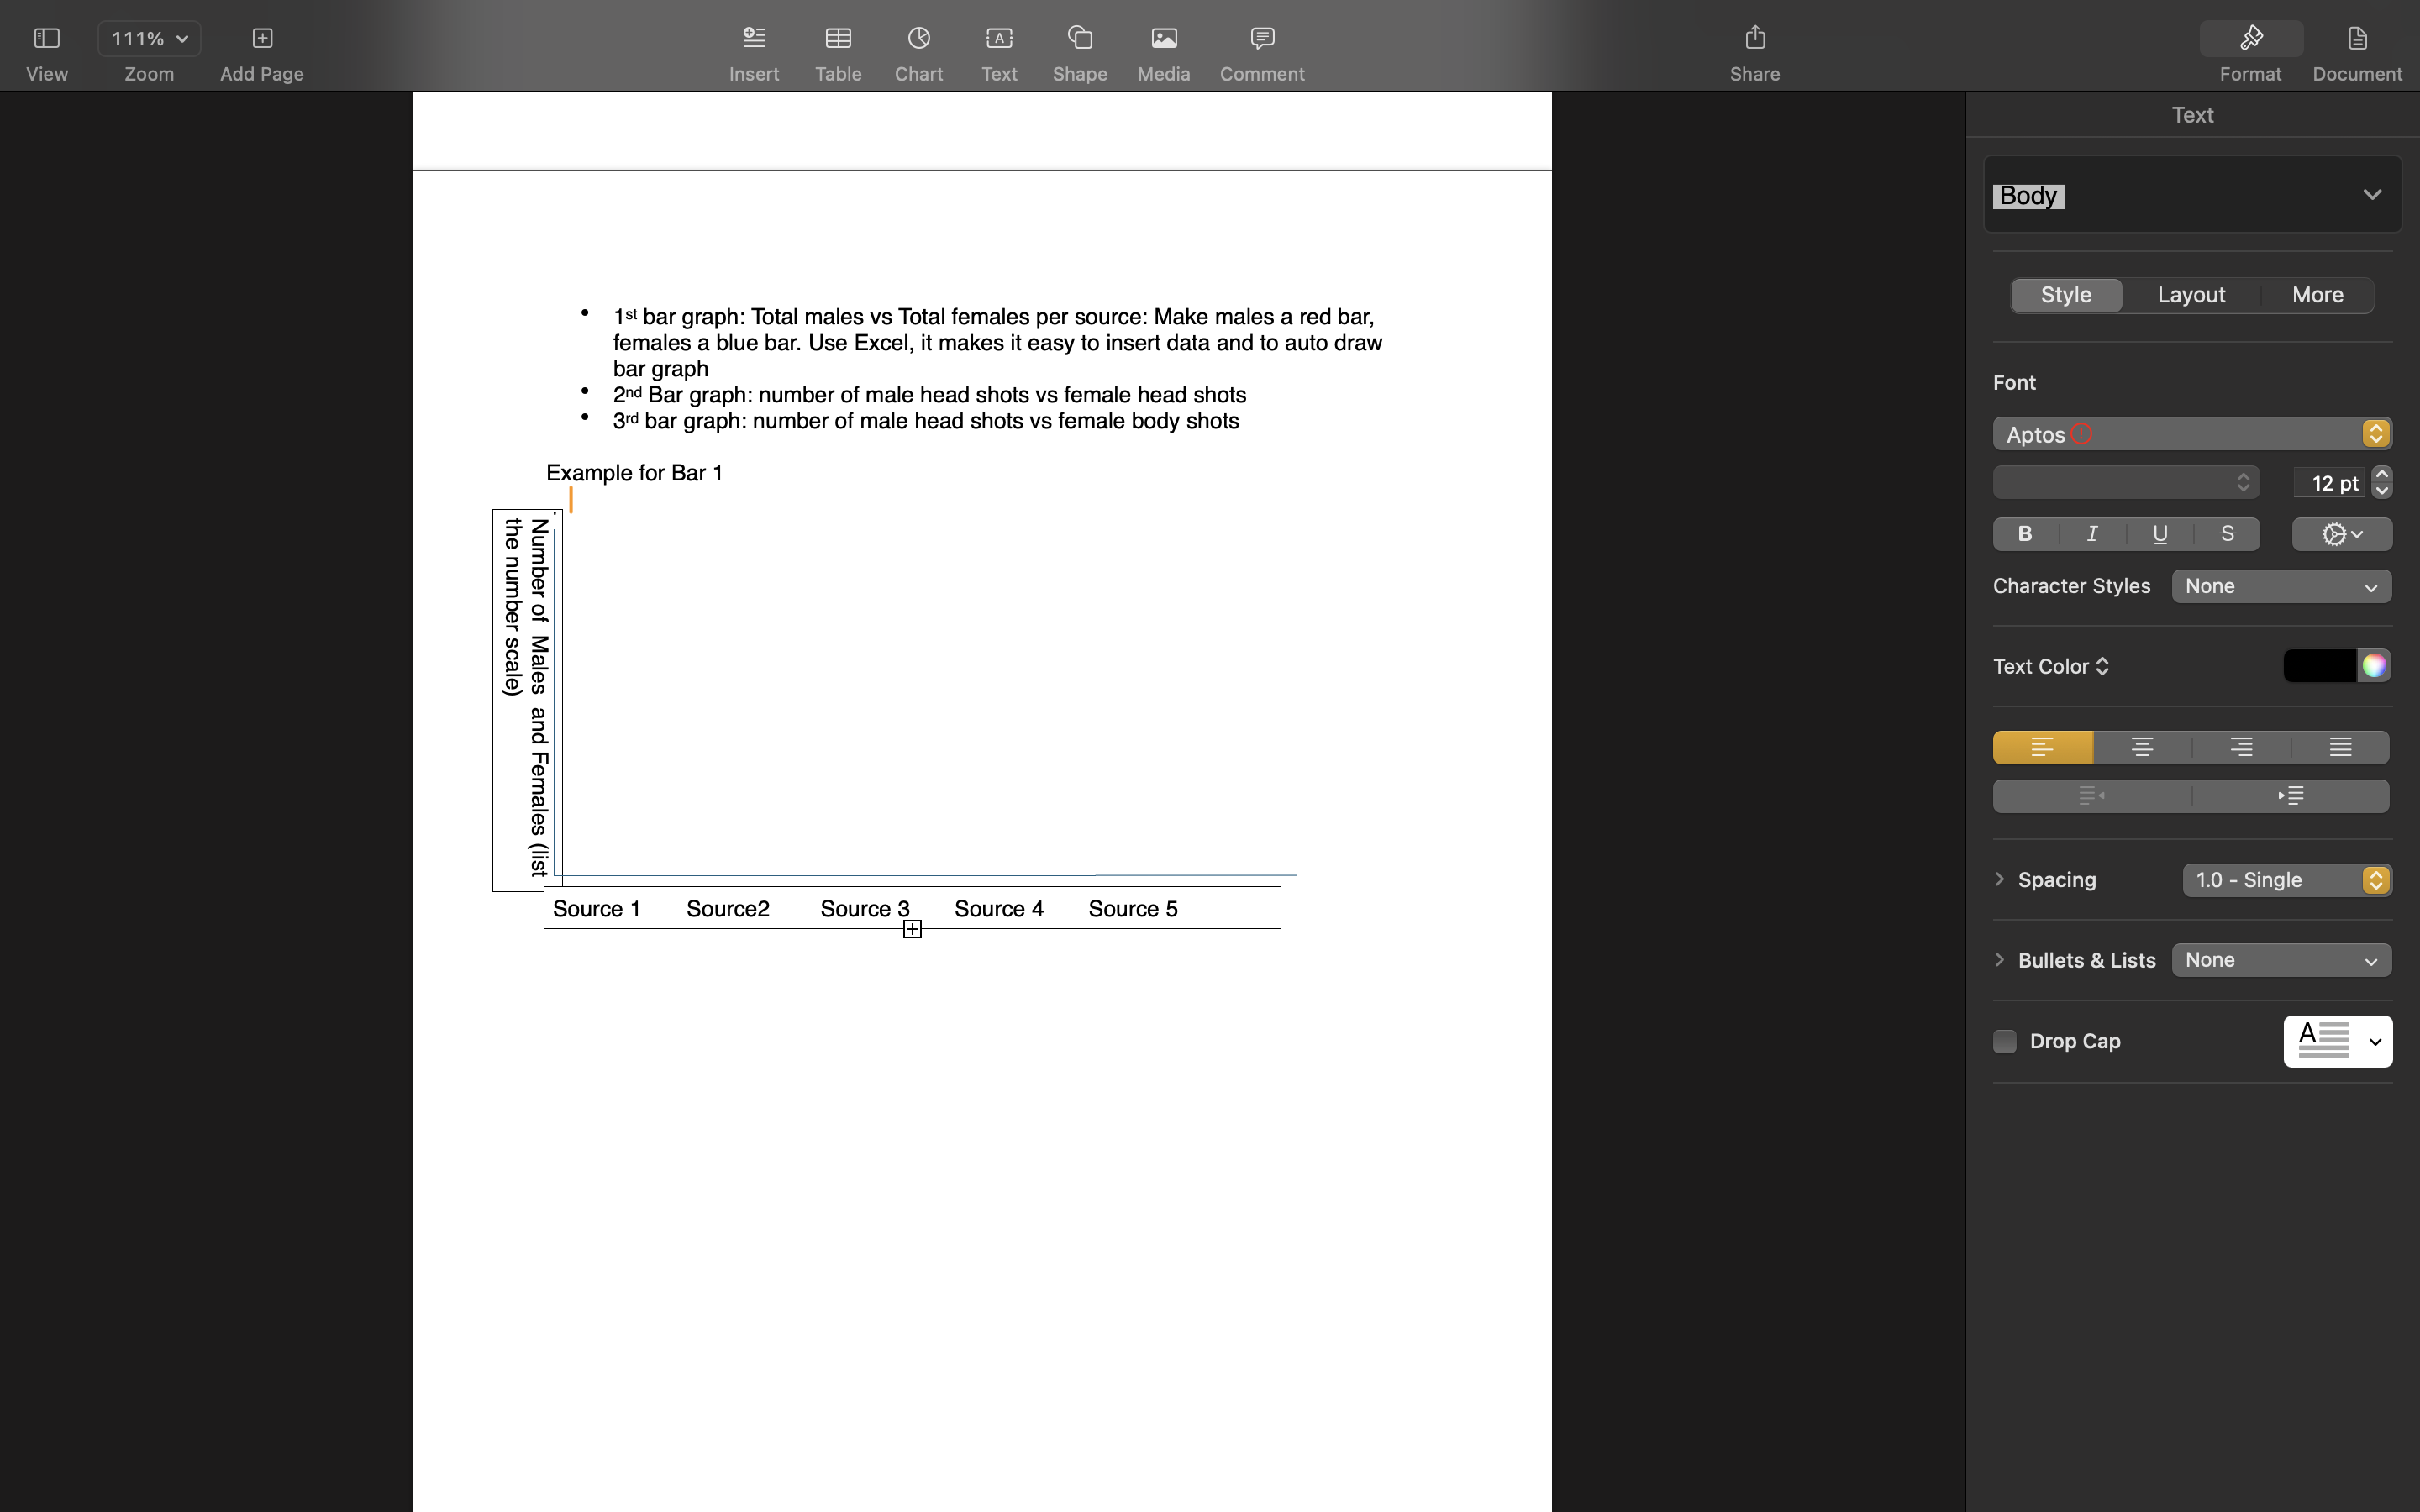
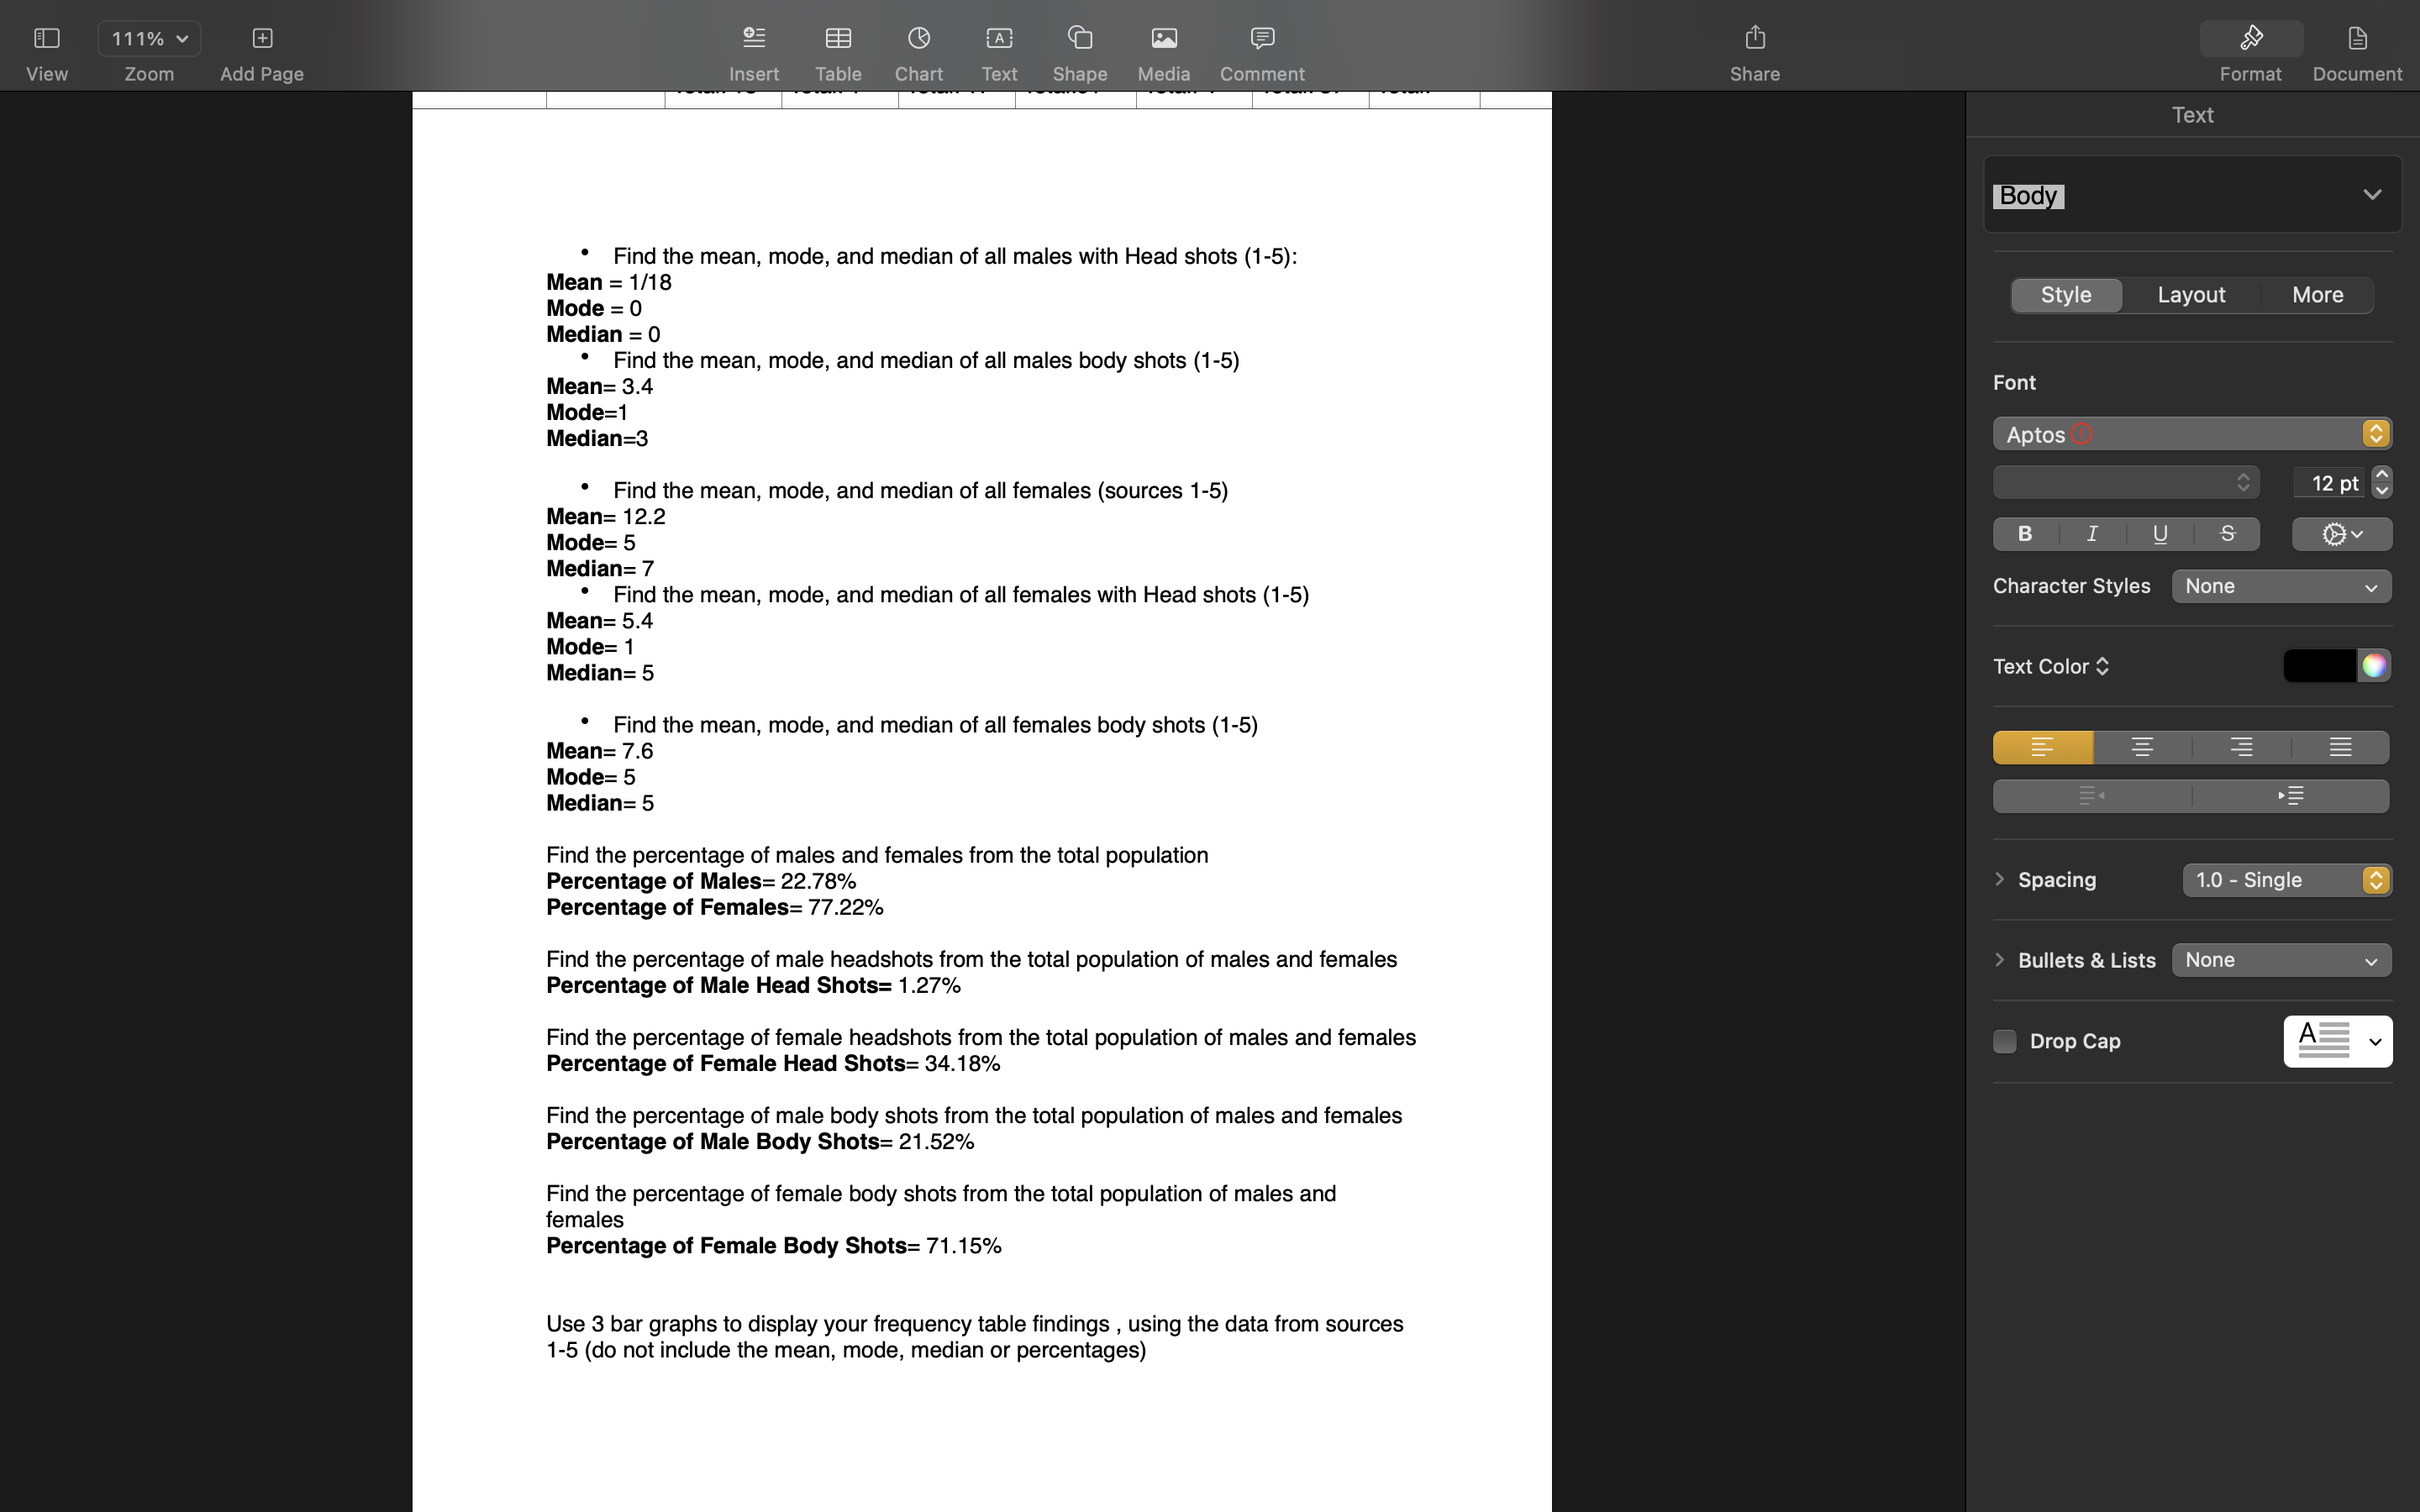
This is the information I collected
Step by Step Solution
There are 3 Steps involved in it
1 Expert Approved Answer
Step: 1 Unlock

Question Has Been Solved by an Expert!
Get step-by-step solutions from verified subject matter experts
Step: 2 Unlock
Step: 3 Unlock