

Question: PracticeProblemActivity-Chapter2-3_fa22 ~ F 125% v + Zoom Add Page Insert Table Chart Text Shape Media Comment 4) What is the best type of graph (bar,
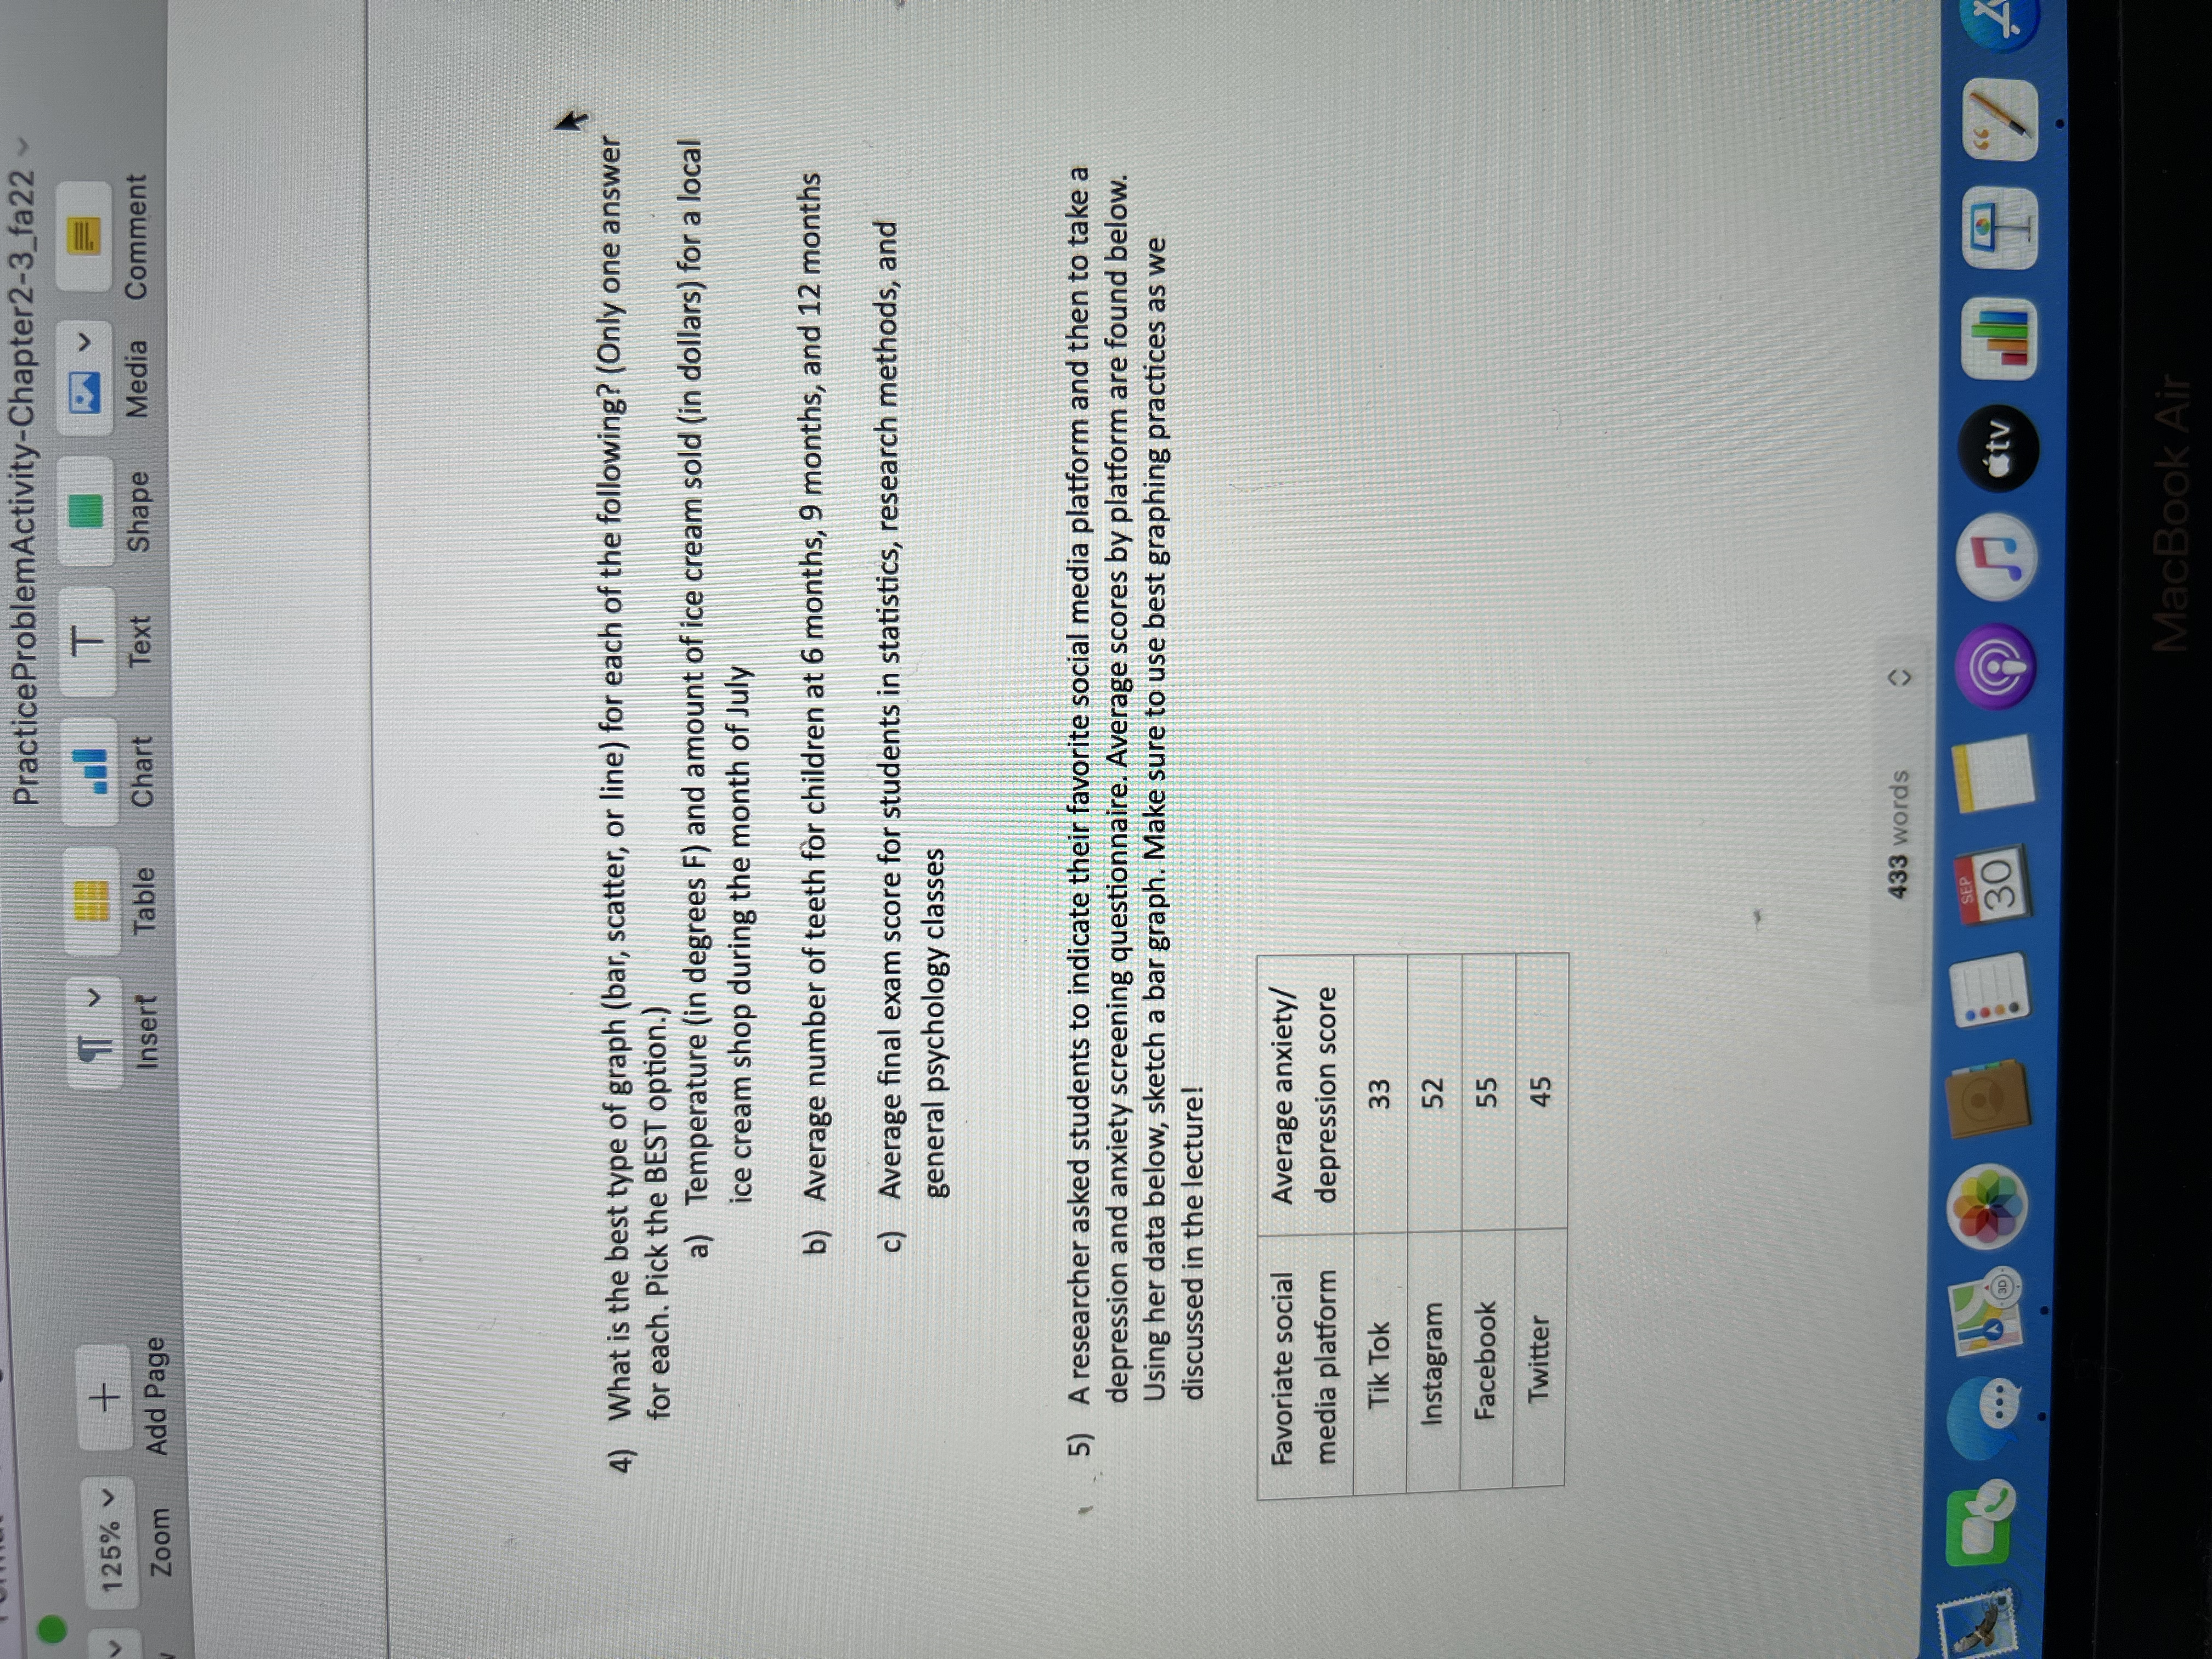


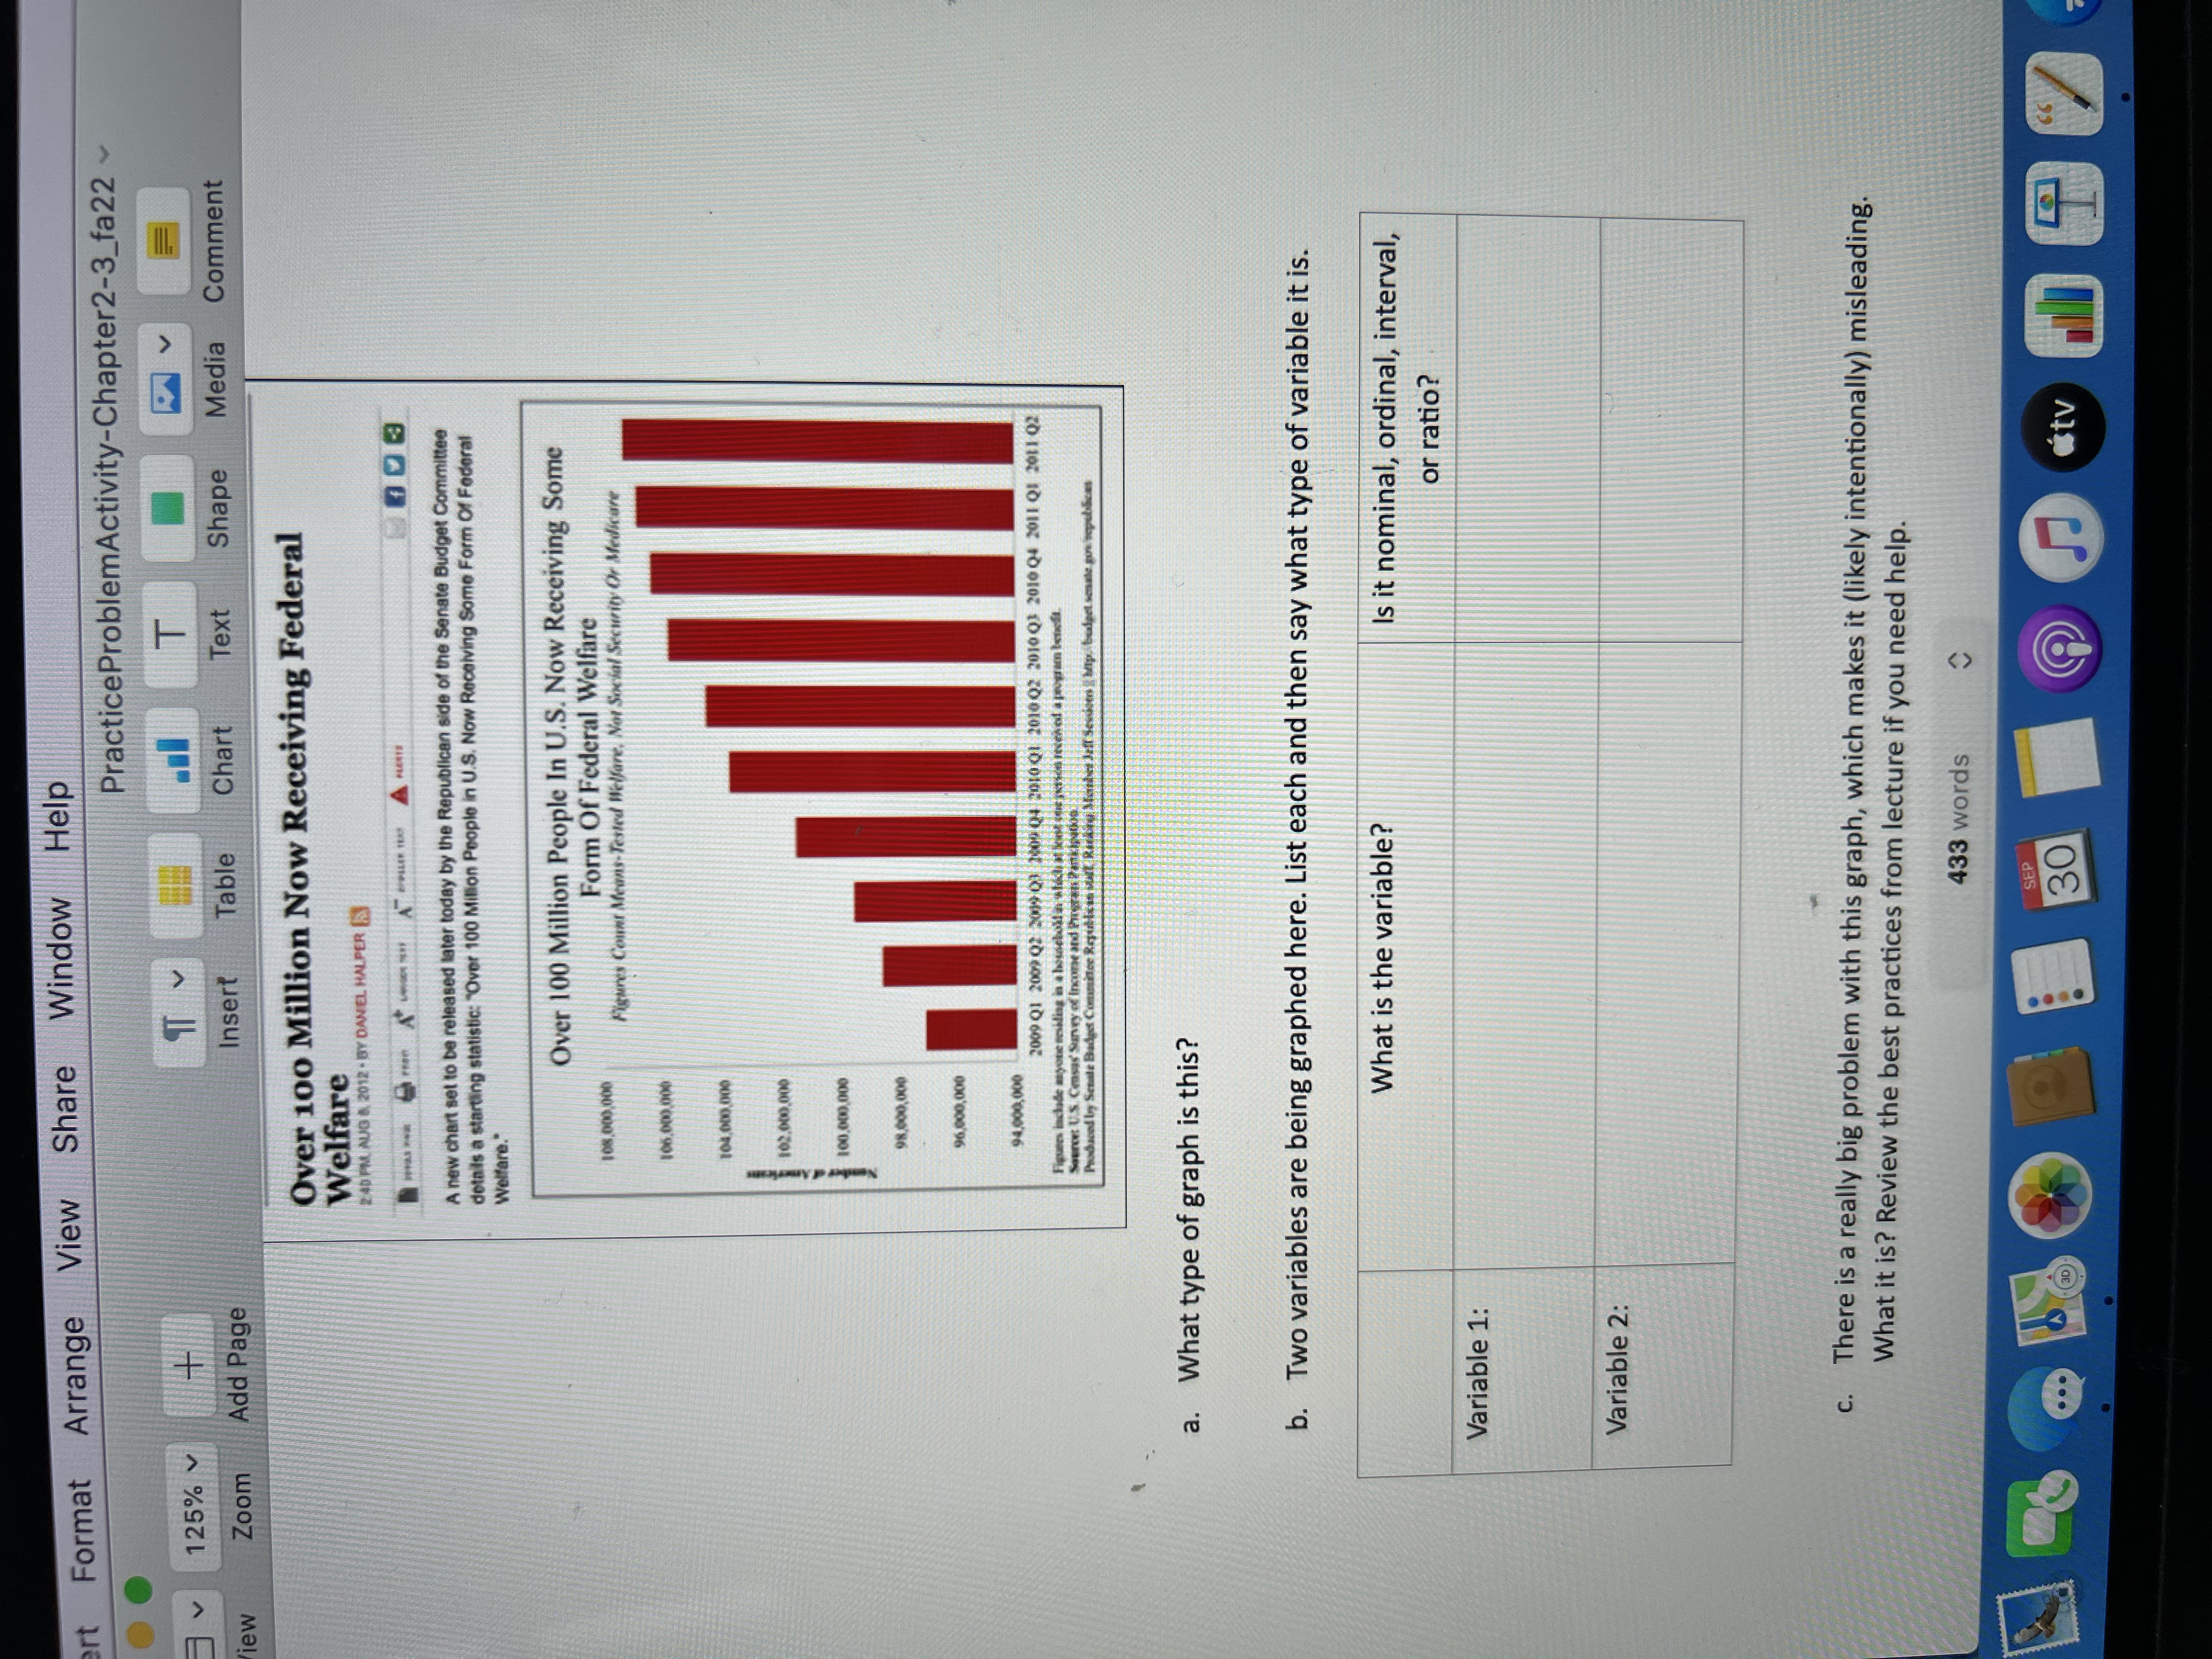
PracticeProblemActivity-Chapter2-3_fa22 ~ F 125% v + Zoom Add Page Insert Table Chart Text Shape Media Comment 4) What is the best type of graph (bar, scatter, or line) for each of the following? (Only one answer for each. Pick the BEST option. a) Temperature (in degrees F) and amount of ice cream sold (in dollars) for a local ice cream shop during the month of July b) Average number of teeth for children at 6 months, 9 months, and 12 months c) Average final exam score for students in statistics, research methods, and general psychology classes * 5) A researcher asked students to indicate their favorite social media platform and then to take a depression and anxiety screening questionnaire. Average scores by platform are found below. Using her data below, sketch a bar graph. Make sure to use best graphing practices as we discussed in the lecture! Favoriate social Average anxiety/ media platform depression score Tik Tok 33 Instagram Facebook Twitter 433 words SEP 8 30 MacBook Airrt Format Arrange View Share Window Help PracticeProblemActivity-Chapter2-3_fa22~ 125% v iew Zoom Add Page Insert Table Chart Text Shape Media Comment Over 100 Million Now Receiving Federal Welfare 2:40 PM AUG 8 2012 - BY DANIEL HALPER ES A new chart set to be released later today by the Republican side of the Senate Budget Committee details a starting statistic: "Over 100 Million People in U.S. Now Receiving Some Form Of Federal Welfare." Over 100 Million People In U.S. Now Receiving Some 108,000,060 Form Of Federal Welfare Figures Count Means-Tested Welfare. Not Social Security Or Medicare 106,000,006 104,000,090 102.050.090 100,080,000 98,600,000 96,000,000 94,600,090 2009 Q1 2009 02 2019 03 2909 04 2016 01 2010 02 2010 Q3 2010 04 2011 Q1 2011 02 a. What type of graph is this? b. Two variables are being graphed here. List each and then say what type of variable it is. What is the variable? Is it nominal, ordinal, interval, or ratio? Variable 1: Variable 2: C. There is a really big problem with this graph, which makes it (likely intentionally) misleading What it is? Review the best practices from lecture if you need help. 433 words SEP 8 30 city
Step by Step Solution
There are 3 Steps involved in it

Get step-by-step solutions from verified subject matter experts