

Question: This is the problem, already filled in the expected rate of return. Using excel formula solve the variance, STDV, and CV. and the rest has
This is the problem, already filled in the expected rate of return. Using excel formula solve the variance, STDV, and CV. and the rest has instructions. Please and thank you. its a little zoomed out but if you the zoom the screen you can see it
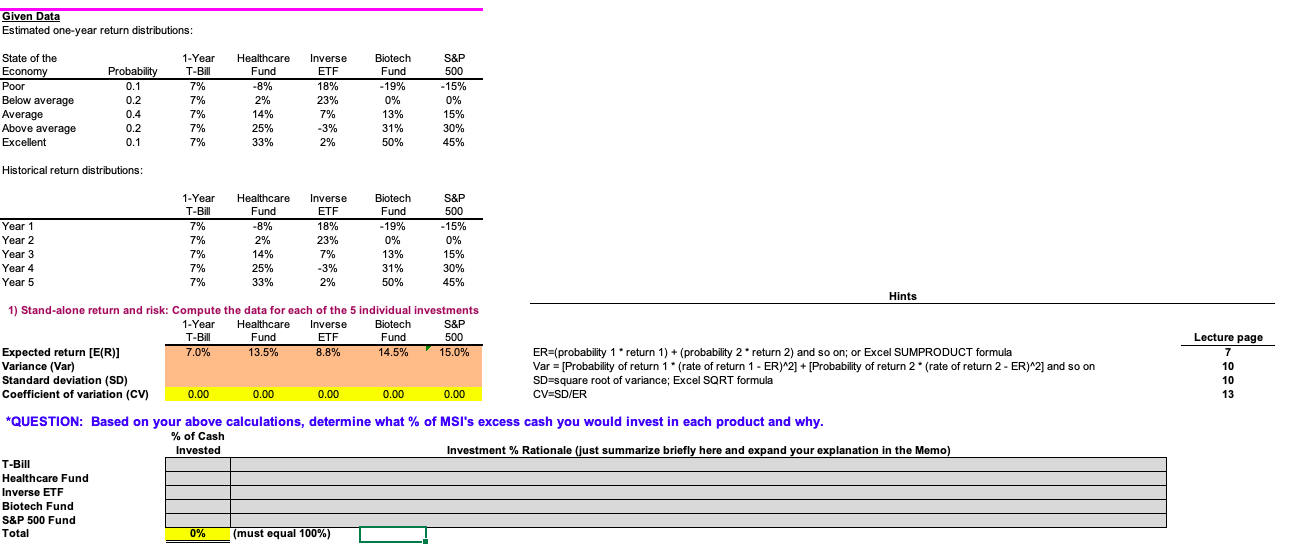
Given Data Estimated one-year return distributions: State of the Economy Poor Below average Average Above average Excellent Probability 0.1 0.2 0.4 0.2 0.1 1-Year T-Bill 7% 7% 7% 7% 7% Healthcare Fund -8% 2% 14% 25% 33% Inverse ETF 18% 23% 7% -3% 2% Biotech Fund - 19% 0% 13% 31% 50% S&P 500 -15% 0% 15% 30% 45% Historical return distributions: 7.0% 13.5% 8.8% 1-Year Healthcare Inverse Biotech S&P T-Bill Fund ETF Fund 500 Year 1 7% -8% 18% -19% -15% Year 2 7% 2% 23% 0% 0% Year 3 7% 14% 7% 13% 15% Year 4 7% 25% -3% 31% 30% Year 5 7% % 33% 2% 50% 45% Hints 1) Stand-alone return and risk: Compute the data for each of the 5 individual investments 1-Year Healthcare Inverse Biotech S&P T-Bill Fund ETF Fund 500 Expected return [E(R)] 14.5% 15.0% ER=(probability 1 * return 1) + (probability 2* return 2) and so on; or Excel SUMPRODUCT formula Variance (Var) Var = [Probability of return 1 rate of return 1 - ER) 2] + [Probability of return 2* (rate of return 2 - ER) 2] and so on Standard deviation (SD) SD=square root of variance; Excel SQRT formula Coefficient of variation (CV) 0.00 0.00 0.00 0.00 0.00 CV=SD/ER *QUESTION: Based on your above calculations, determine what % of MSI's excess cash you would invest in each product and why. % of Cash Invested Investment % Rationale (just summarize briefly here and expand your explanation in the Memo) T-BILI Healthcare Fund Inverse ETF Biotech Fund S&P 500 Fund Total 0% (must equal 100%) Lecture page 7 10 10 13 Given Data Estimated one-year return distributions: State of the Economy Poor Below average Average Above average Excellent Probability 0.1 0.2 0.4 0.2 0.1 1-Year T-Bill 7% 7% 7% 7% 7% Healthcare Fund -8% 2% 14% 25% 33% Inverse ETF 18% 23% 7% -3% 2% Biotech Fund - 19% 0% 13% 31% 50% S&P 500 -15% 0% 15% 30% 45% Historical return distributions: 7.0% 13.5% 8.8% 1-Year Healthcare Inverse Biotech S&P T-Bill Fund ETF Fund 500 Year 1 7% -8% 18% -19% -15% Year 2 7% 2% 23% 0% 0% Year 3 7% 14% 7% 13% 15% Year 4 7% 25% -3% 31% 30% Year 5 7% % 33% 2% 50% 45% Hints 1) Stand-alone return and risk: Compute the data for each of the 5 individual investments 1-Year Healthcare Inverse Biotech S&P T-Bill Fund ETF Fund 500 Expected return [E(R)] 14.5% 15.0% ER=(probability 1 * return 1) + (probability 2* return 2) and so on; or Excel SUMPRODUCT formula Variance (Var) Var = [Probability of return 1 rate of return 1 - ER) 2] + [Probability of return 2* (rate of return 2 - ER) 2] and so on Standard deviation (SD) SD=square root of variance; Excel SQRT formula Coefficient of variation (CV) 0.00 0.00 0.00 0.00 0.00 CV=SD/ER *QUESTION: Based on your above calculations, determine what % of MSI's excess cash you would invest in each product and why. % of Cash Invested Investment % Rationale (just summarize briefly here and expand your explanation in the Memo) T-BILI Healthcare Fund Inverse ETF Biotech Fund S&P 500 Fund Total 0% (must equal 100%) Lecture page 7 10 10 13
Step by Step Solution
There are 3 Steps involved in it

Get step-by-step solutions from verified subject matter experts