

Question: This is the question with data below For each of the scenarios below, use Excel to access the data (See the instructions of this assignment
This is the question with data below
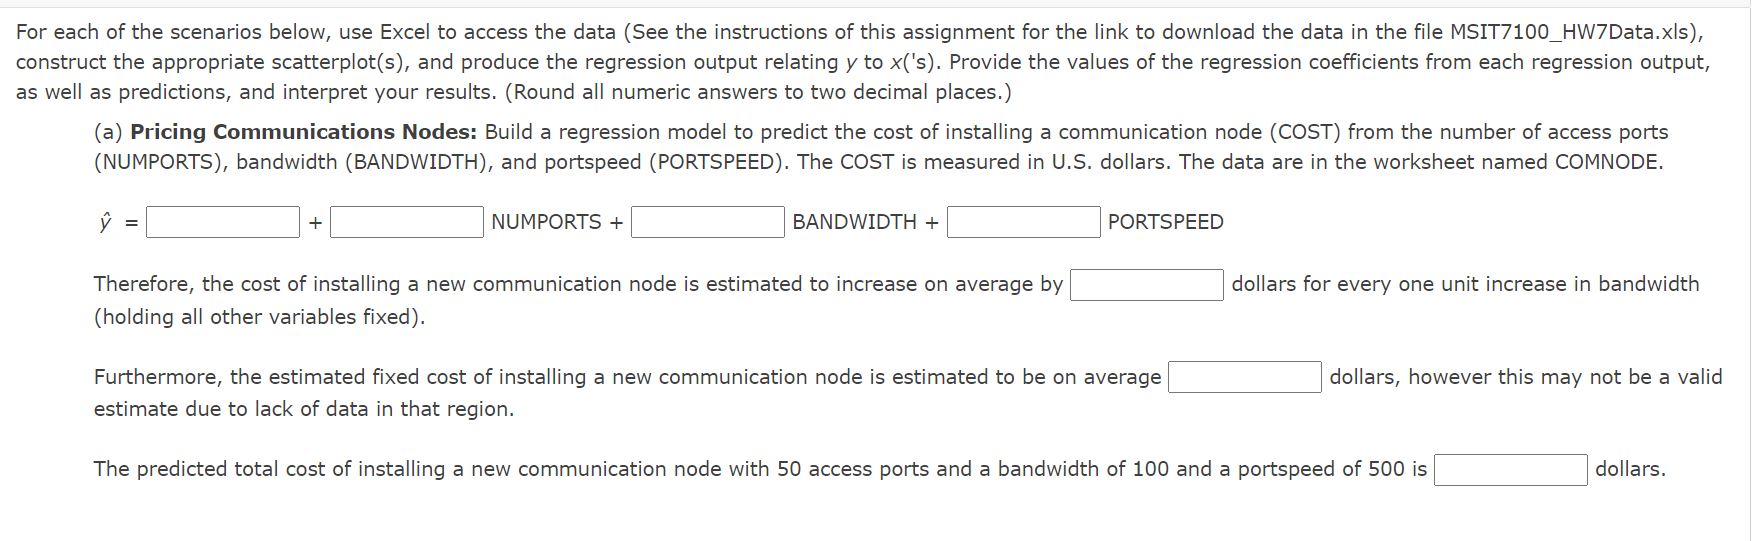
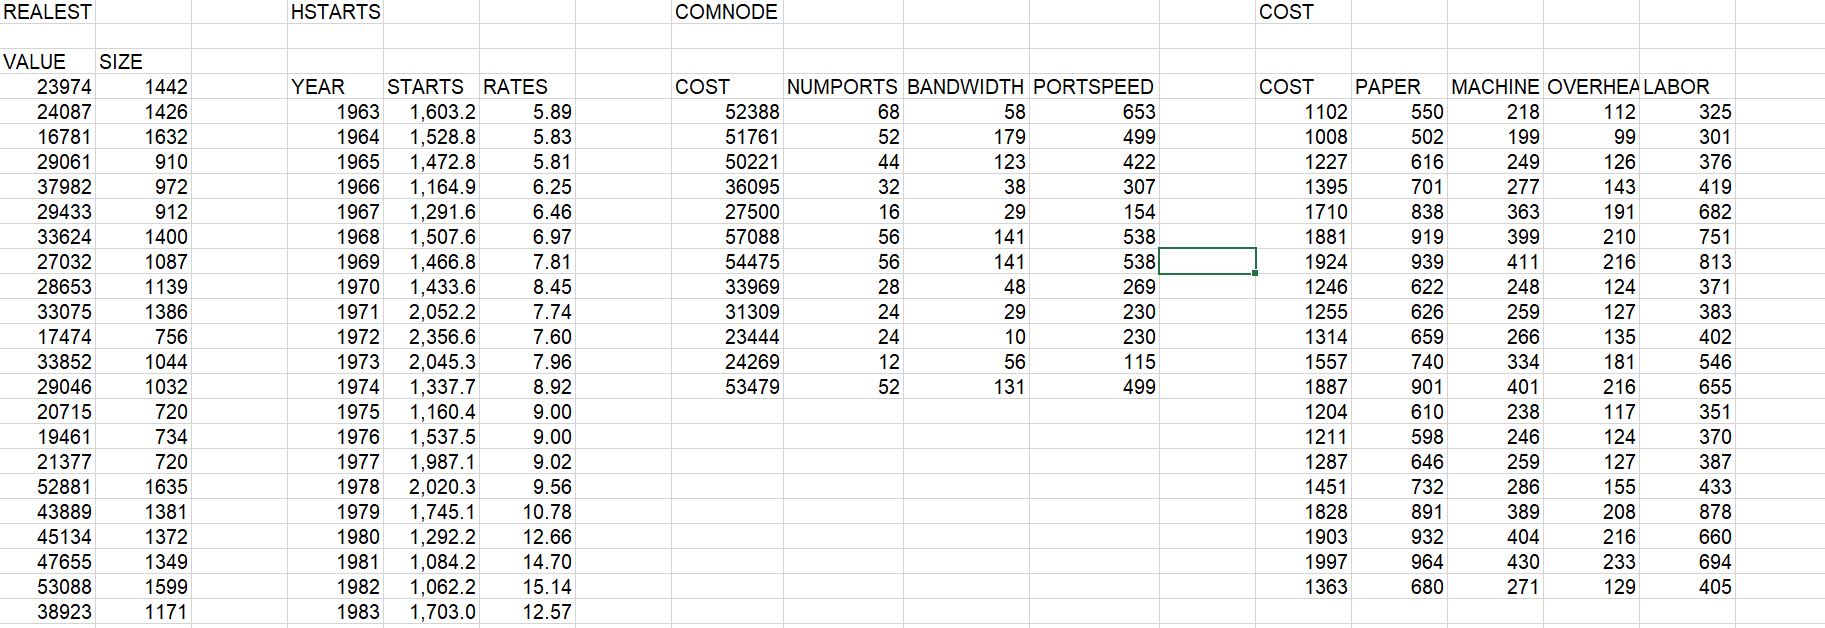
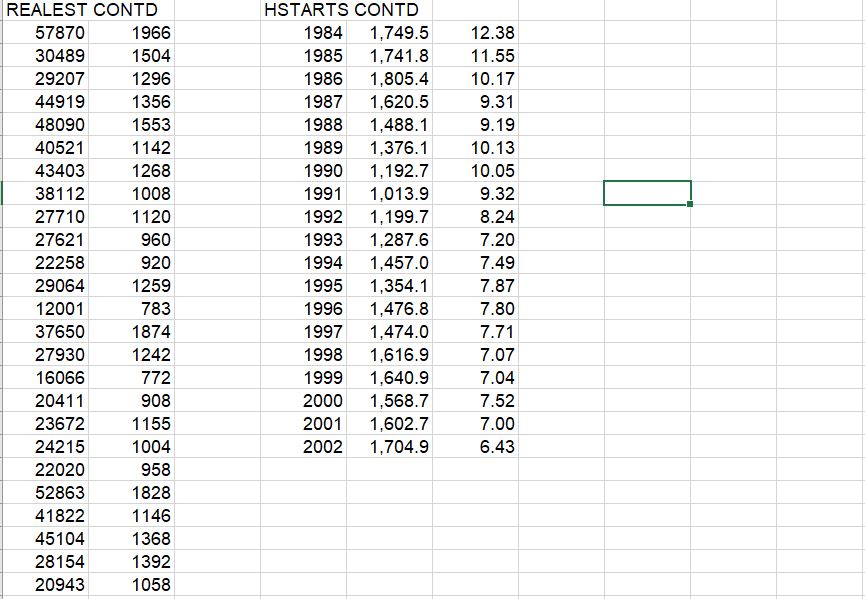


For each of the scenarios below, use Excel to access the data (See the instructions of this assignment for the link to download the data in the le MSIT71007HW7Data.xls), construct the appropriate scatterplot(s), and produce the regression output relating y to x('s). Provide the values of the regression coefcients from each regression output, as well as predictions, and interpret your results. (Round all numeric answers to two decimal places.) (a) Pricing Communications Nodes: Build a regression model to predict the cost of installing a communication node (COST) from the number of access ports (NUMPORTS), bandwidth (BANDWIDTH), and portspeed (PORTSPEED). The COST is measured in U.S. dollars. The data are in the worksheet named COMNODE. Therefore, the cost of installing a new communication node is estimated to increase on average by S dollars for every one unit increase in bandwidth (holding all other variables xed). Furthermore, the estimated fixed cost of installing a new communication node is estimated to be on average I: dollars, however this may not be a valid estimate due to lack of data in that region. The predicted total cost of installing a new communication node with 50 access ports and a bandwidth of 100 and a portspeed of 500 is \\:| dollars. \f\f\f\f
Step by Step Solution
There are 3 Steps involved in it

Get step-by-step solutions from verified subject matter experts