

Question: This is the second time I post this question, I need an answer please. I do not want you to analyze the data for me.
This is the second time I post this question, I need an answer please.
I do not want you to analyze the data for me. I just want to know the formulas or the commands that I will use in EViews program. Logarithms of real equity price, and real dividends. And why Earnings series is included in the data? If you can check from the official textbook solution, it will be great.
This question from this textbook: Financial Econometric Modelling by: Stan Hurn, Vance L. Martin, Jun Yu, and Peter C.B. Phillips.
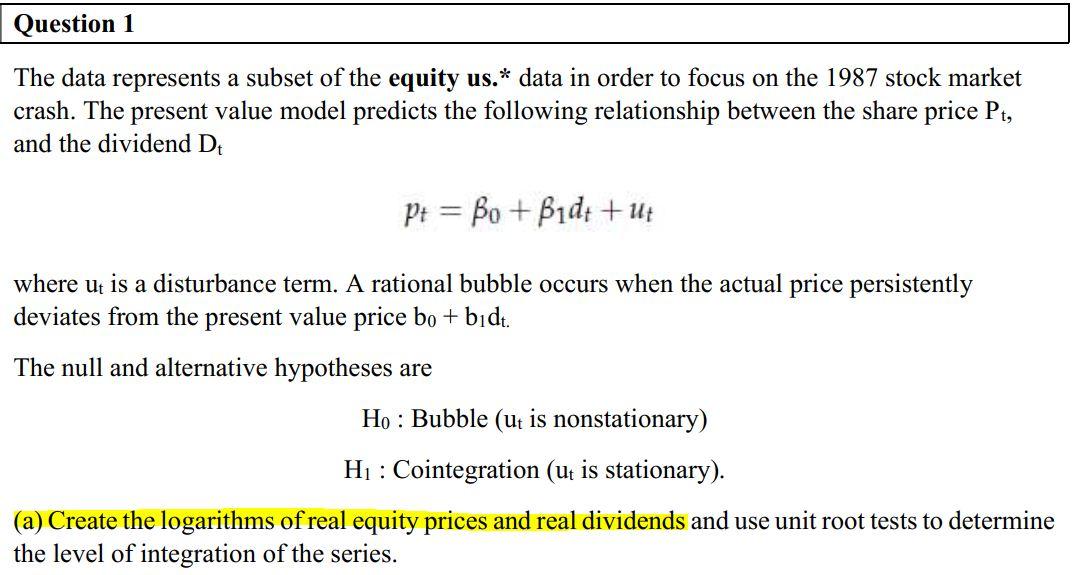
Question 1 The data represents a subset of the equity us.* data in order to focus on the 1987 stock market crash. The present value model predicts the following relationship between the share price Pt, and the dividend Dt P+ = Bo + Bid+ + ut where ut is a disturbance term. A rational bubble occurs when the actual price persistently deviates from the present value price bo + bidt. The null and alternative hypotheses are Ho : Bubble (ut is nonstationary) Hi : Cointegration (ut is stationary). (a) Create the logarithms of real equity prices and real dividends and use unit root tests to determine the level of integration of the series. Series: CPI Workfile: EQUITIES US:Untitled Sort Edit +/- Smpl- 41.43 View Proc Object Properties View Proc Object Properties View Proc Object Properties Print Name Freeze Default 42.80333333 20 m2 7 Workfile: EQUITIES_US - (c:\us Series: PRICE Workfile: Eor Series: DIVIDEND Workfil View Proc Object Save Snapsh View Proc Object Properties Series: EARNINGS Workfi Range: 1871 M01 2016M09 Sample: 1871 M01 2016M09 BC La 2015M02 40.35333333 2015MO2 100.27 dividend 1871 M01 4.44 2015M03 40.81 2015M03 99.25 earnings 1871 MO2 4.5 2015M04 41.12 price 2015M04 97.80333333 2015M05 1871 M03 4.61 M resid 2015M05 96.35666667 2015M06 1871 M04 4.74 41.74 1974 MOC 2015M06 2015M07 1871 M05 94.91 41.99666667 4.86 Metamod 022992 2015MO7 2015MOS 93.49333333 1871 M06 4.82 42.25333333 2015MU8 2016MAS ATAM 40 2015M08 92.07666667 1871 M07 4.73 42.51 2015MUS 2014 MOD 42.01 Metamor po ed 40 2015M09 90.66 4.79 1871 M08 2015MTU 1024 MOD 2015M10 89.28333333 1871 M09 4.84 2015M 11 43.09666667 304541 ATAMA ce 87.90666667 4.59 1871 M10 2015M11 2015M12 43.39 De 2015M12 he 86.53 1871 M11 4.64 2016M01 43.55333333 304 MO1 OG MAMA 2016M02 86.5 1871 M12 4.74 43.71666667 2016M03 2016MO2 86.47 1872M01 4.86 43.88 2016MUS 2016M02 4ozama 2016M03 To 86.44 1872M02 4.88 2016M04 44.07333333 2016MOA oe 1075mg oi 2016M04 1872M03 2016M05 44.26666667 86.6 5.04 201 AMOS 1075MOX 1872M04 5.18 2016M06 2016M05 44.46 86.76 86.92 2016M06 1872M05 5.18 2016M07 44.65 2016 MO7 87.64333333 1872M06 5.13 2016 M08 44.84 88.36666667 2016MOS 1872M07 51 2016M09 45.03 2016M09 89.09 1872M08 Untitled New Page 2015MO2 2015M03 2015M04 2015M05 Bucured 2015M06 204 CMOS 2015M07 204 cm 2015M08 ole 2015M09 New 2015M10 2015 M11 BACHA 2015M12 201 2016M01 2016 MO2 2016M03 onemo 2016M04 204 MOE 2016M05 204 emne 2016MO6 2016M07 2016M08 2016M09 234.722 236.119 236.599 237.805 238.638 door 238.654 09 238.316 2070 237.945 40 237.838 4700d 237.336 de cas 236.525 od 236.916 07:44 237.111 2004 238.132 2000 239.261 340 220 240.229 241.018 240.628 240.849 241.428 Question 1 The data represents a subset of the equity us.* data in order to focus on the 1987 stock market crash. The present value model predicts the following relationship between the share price Pt, and the dividend Dt P+ = Bo + Bid+ + ut where ut is a disturbance term. A rational bubble occurs when the actual price persistently deviates from the present value price bo + bidt. The null and alternative hypotheses are Ho : Bubble (ut is nonstationary) Hi : Cointegration (ut is stationary). (a) Create the logarithms of real equity prices and real dividends and use unit root tests to determine the level of integration of the series. Series: CPI Workfile: EQUITIES US:Untitled Sort Edit +/- Smpl- 41.43 View Proc Object Properties View Proc Object Properties View Proc Object Properties Print Name Freeze Default 42.80333333 20 m2 7 Workfile: EQUITIES_US - (c:\us Series: PRICE Workfile: Eor Series: DIVIDEND Workfil View Proc Object Save Snapsh View Proc Object Properties Series: EARNINGS Workfi Range: 1871 M01 2016M09 Sample: 1871 M01 2016M09 BC La 2015M02 40.35333333 2015MO2 100.27 dividend 1871 M01 4.44 2015M03 40.81 2015M03 99.25 earnings 1871 MO2 4.5 2015M04 41.12 price 2015M04 97.80333333 2015M05 1871 M03 4.61 M resid 2015M05 96.35666667 2015M06 1871 M04 4.74 41.74 1974 MOC 2015M06 2015M07 1871 M05 94.91 41.99666667 4.86 Metamod 022992 2015MO7 2015MOS 93.49333333 1871 M06 4.82 42.25333333 2015MU8 2016MAS ATAM 40 2015M08 92.07666667 1871 M07 4.73 42.51 2015MUS 2014 MOD 42.01 Metamor po ed 40 2015M09 90.66 4.79 1871 M08 2015MTU 1024 MOD 2015M10 89.28333333 1871 M09 4.84 2015M 11 43.09666667 304541 ATAMA ce 87.90666667 4.59 1871 M10 2015M11 2015M12 43.39 De 2015M12 he 86.53 1871 M11 4.64 2016M01 43.55333333 304 MO1 OG MAMA 2016M02 86.5 1871 M12 4.74 43.71666667 2016M03 2016MO2 86.47 1872M01 4.86 43.88 2016MUS 2016M02 4ozama 2016M03 To 86.44 1872M02 4.88 2016M04 44.07333333 2016MOA oe 1075mg oi 2016M04 1872M03 2016M05 44.26666667 86.6 5.04 201 AMOS 1075MOX 1872M04 5.18 2016M06 2016M05 44.46 86.76 86.92 2016M06 1872M05 5.18 2016M07 44.65 2016 MO7 87.64333333 1872M06 5.13 2016 M08 44.84 88.36666667 2016MOS 1872M07 51 2016M09 45.03 2016M09 89.09 1872M08 Untitled New Page 2015MO2 2015M03 2015M04 2015M05 Bucured 2015M06 204 CMOS 2015M07 204 cm 2015M08 ole 2015M09 New 2015M10 2015 M11 BACHA 2015M12 201 2016M01 2016 MO2 2016M03 onemo 2016M04 204 MOE 2016M05 204 emne 2016MO6 2016M07 2016M08 2016M09 234.722 236.119 236.599 237.805 238.638 door 238.654 09 238.316 2070 237.945 40 237.838 4700d 237.336 de cas 236.525 od 236.916 07:44 237.111 2004 238.132 2000 239.261 340 220 240.229 241.018 240.628 240.849 241.428
Step by Step Solution
There are 3 Steps involved in it

Get step-by-step solutions from verified subject matter experts