

Question: this is the task that i have to do Time the amount of time a goose spent scanning (use a stopwatch, e.g. on a phone
this is the task that i have to do
- Time the amount of time a goose spent scanning (use a stopwatch, e.g. on a phone or computer).
Make two scatter graphs of the results.
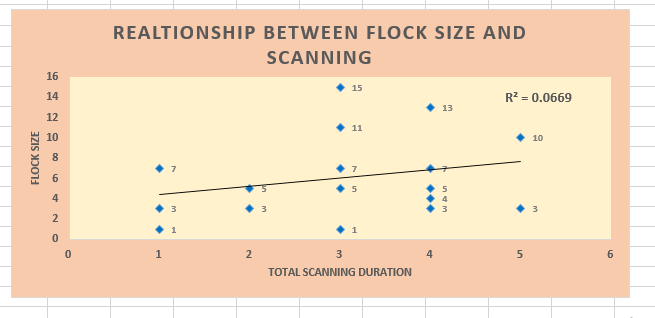
- Graphs should answer the following: o What is the relationship between flock size and frequency of scanning?
- What is the relationship between flock size and duration of scanning?
- Write two figure captions that describe the trends and features of the data you are showing in your graphs (including the measure of variation you have used if that is applicable).
Is the graphs that i have done correct?
is the y -axis and x - axis correctly imputed?
is it fine to have one of the r^2 values with a zero after the decimal place for a graph (graph 2 )?
Is there anything that i must change/do ?
This is the data : i have written the flock size 2 times becuase both graphs required the flock size
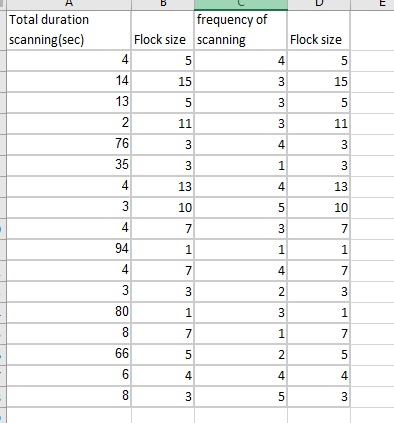
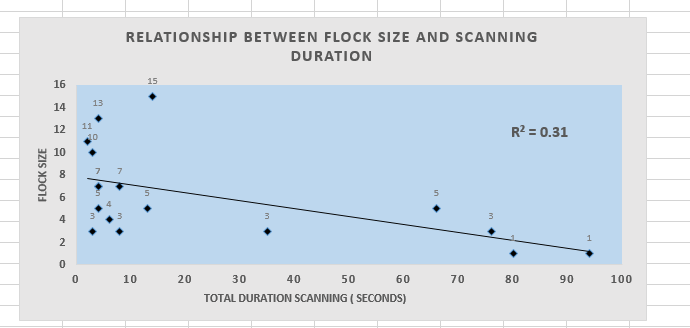
Total duration frequency of scanning (sec) Flock size scanning Flock size 4 5 4 5 14 15 15 13 5 5 2 11 11 76 3 A 3 35 3 3 4 13 A 13 10 5 10 4 7 7 94 H 7 80 1 7 N H 66 5 6 4 4 4 CO 3 5 3RELATIONSHIP BETWEEN FLOCK SIZE AND SCANNING DURATION 16 15 14 13 12 11 R2 = 0.31 10 FLOCK SIZE 8 5 6 5 4 3 1 0 10 20 30 40 50 60 70 80 90 100 TOTAL DURATION SCANNING ( SECONDS)
Step by Step Solution
There are 3 Steps involved in it

Get step-by-step solutions from verified subject matter experts