Question: This is the third post for this. I only nee MSE/MAPE can't seem to get the answer right. Thank you! The table below shows actual

This is the third post for this. I only nee MSE/MAPE can't seem to get the answer right. Thank you!This is the third post for this. I only nee

The table below shows actual and forecasted nubmers of accounts serviced by a company. Compute MAD, MSE, and MAPE for the following data, showing actual and forecasted numbers of accounts serviced. (Enter whole number values in the table below for Error, IErrorl, and Error 2. Round the IErrorl/Actual to three decimals. Enter O where necessary, do not leave any cells blank. Negative values should be indicated with a minus sign, i.e. -2. Round MAD, MSE and MAPE to 3 decimal places.) Period Actual Forecast 1 2 1 A- F(Error) 3 -1 -2 -1 3 928 926 927 931 934 936 939 925 927 929 932 934 Answer is not complete. Error Error2 (Error/Actual) 100 3 9 0.323 1 0.108 2 0.216 1 1 0.107 0 0.000 1 0.107 0 0.000 2 0.212 4 5 6 937 7 939 0 2 8 944 942 Answer is complete but not entirely correct. MAD MSE 1.250 2.500 X 13.413 MAPE

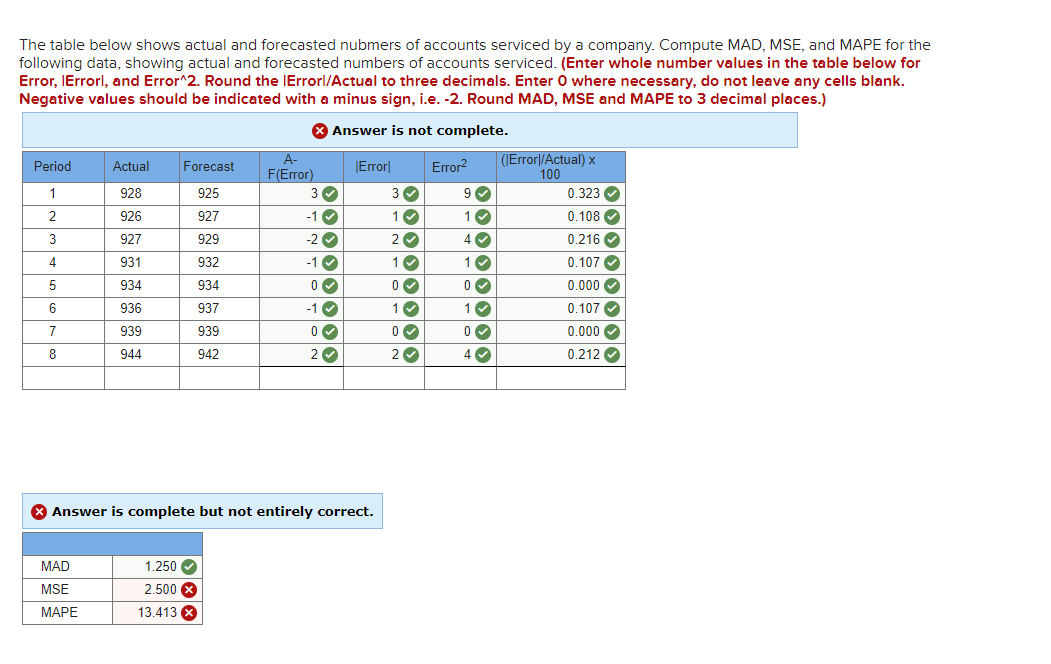
Step by Step Solution

There are 3 Steps involved in it

1 Expert Approved Answer
Step: 1 Unlock blur-text-image
Question Has Been Solved by an Expert!

Get step-by-step solutions from verified subject matter experts

Step: 2 Unlock
Step: 3 Unlock

Students Have Also Explored These Related General Management Questions!