

Question: This is the way I found that can upload the dataset, sorry about the inconvenience. Amanta Appliances sells two styles of refrigerators at more than
This is the way I found that can upload the dataset, sorry about the inconvenience.
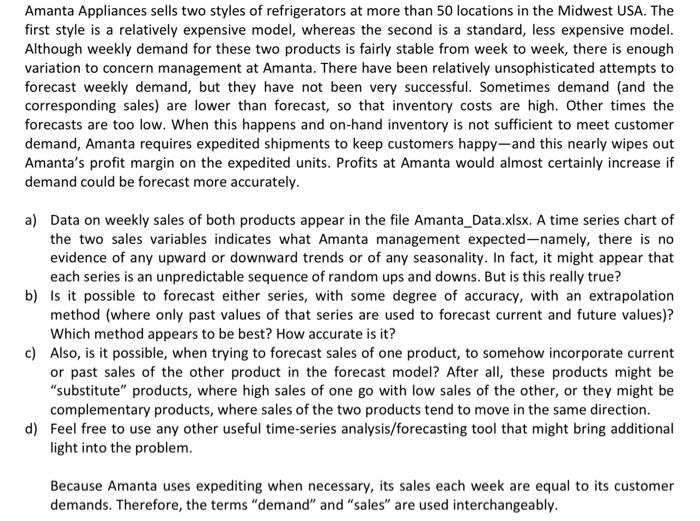
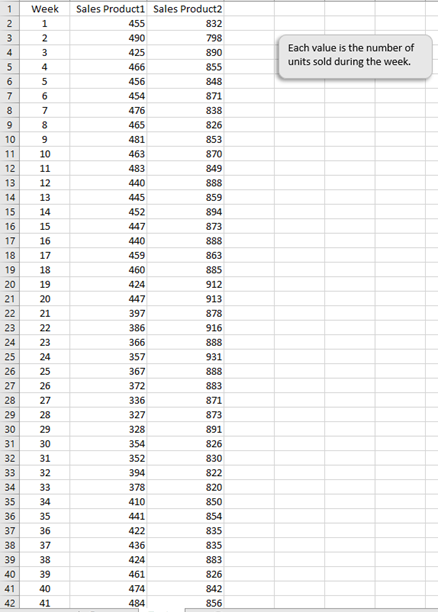
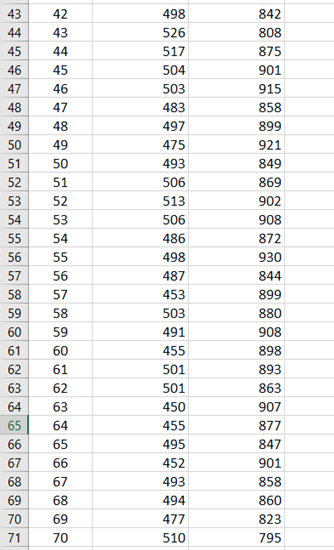
Amanta Appliances sells two styles of refrigerators at more than 50 locations in the Midwest USA. The first style is a relatively expensive model, whereas the second is a standard, less expensive model. Although weekly demand for these two products is fairly stable from week to week, there is enough variation to concern management at Amanta. There have been relatively unsophisticated attempts to forecast weekly demand, but they have not been very successful. Sometimes demand (and the corresponding sales) are lower than forecast, so that inventory costs are high. Other times the forecasts are too low. When this happens and on-hand inventory is not sufficient to meet customer demand, Amanta requires expedited shipments to keep customers happy-and this nearly wipes out Amanta's profit margin on the expedited units. Profits at Amanta would almost certainly increase if demand could be forecast more accurately. a) Data on weekly sales of both products appear in the file Amanta_Data.xlsx. A time series chart of the two sales variables indicates what Amanta management expected-namely, there is no evidence of any upward or downward trends or of any seasonality. In fact, it might appear that each series is an unpredictable sequence of random ups and downs. But is this really true? b) Is it possible to forecast either series, with some degree of accuracy, with an extrapolation method (where only past values of that series are used to forecast current and future values)? Which method appears to be best? How accurate is it? c) Also, is it possible, when trying to forecast sales of one product, to somehow incorporate current or past sales of the other product in the forecast model? After all, these products might be "substitute" products, where high sales of one go with low sales of the other, or they might be complementary products, where sales of the two products tend to move in the same direction. d) Feel free to use any other useful time-series analysis/forecasting tool that might bring additional light into the problem. Because Amanta uses expediting when necessary, its sales each week are equal to its customer demands. Therefore, the terms "demand" and "sales" are used interchangeably. 1 2 3 4 5 Each value is the number of units sold during the week. 6 7 8 9 10 11 12 13 14 885 15 16 17 18 19 20 21 22 23 24 25 26 27 28 29 30 31 32 33 34 35 36 37 38 39 40 41 42 Week 1 2 3 4 5 6 7 8 9 10 11 12 13 14 15 16 17 18 19 20 21 22 23 24 25 26 27 28 29 30 31 32 33 34 35 36 37 38 39 40 41 Sales Producti Sales Product2 455 832 490 798 425 890 466 855 456 848 454 871 476 838 465 826 481 853 463 870 483 849 440 888 445 859 452 894 447 873 440 888 459 863 460 424 912 447 913 397 878 386 916 366 888 357 931 367 888 372 883 336 871 327 873 328 891 354 826 352 830 394 822 378 820 410 850 441 854 422 835 436 835 424 883 461 826 474 842 484 856 43 44 45 47 48 49 50 51 52 53 54 55 56 57 58 59 60 61 62 63 64 65 66 67 68 69 70 42 43 44 45 46 47 48 49 50 51 52 53 54 55 56 57 58 59 60 61 62 63 64 65 66 67 68 69 498 526 517 504 503 483 497 475 493 506 513 506 486 498 487 453 503 491 455 501 501 450 455 495 452 493 494 477 510 842 808 875 901 915 8858 899 921 849 869 902 908 8872 930 844 899 8880 908 8898 893 863 907 877 847 901 858 860 823 795 71 70 Amanta Appliances sells two styles of refrigerators at more than 50 locations in the Midwest USA. The first style is a relatively expensive model, whereas the second is a standard, less expensive model. Although weekly demand for these two products is fairly stable from week to week, there is enough variation to concern management at Amanta. There have been relatively unsophisticated attempts to forecast weekly demand, but they have not been very successful. Sometimes demand (and the corresponding sales) are lower than forecast, so that inventory costs are high. Other times the forecasts are too low. When this happens and on-hand inventory is not sufficient to meet customer demand, Amanta requires expedited shipments to keep customers happy-and this nearly wipes out Amanta's profit margin on the expedited units. Profits at Amanta would almost certainly increase if demand could be forecast more accurately. a) Data on weekly sales of both products appear in the file Amanta_Data.xlsx. A time series chart of the two sales variables indicates what Amanta management expected-namely, there is no evidence of any upward or downward trends or of any seasonality. In fact, it might appear that each series is an unpredictable sequence of random ups and downs. But is this really true? b) Is it possible to forecast either series, with some degree of accuracy, with an extrapolation method (where only past values of that series are used to forecast current and future values)? Which method appears to be best? How accurate is it? c) Also, is it possible, when trying to forecast sales of one product, to somehow incorporate current or past sales of the other product in the forecast model? After all, these products might be "substitute" products, where high sales of one go with low sales of the other, or they might be complementary products, where sales of the two products tend to move in the same direction. d) Feel free to use any other useful time-series analysis/forecasting tool that might bring additional light into the problem. Because Amanta uses expediting when necessary, its sales each week are equal to its customer demands. Therefore, the terms "demand" and "sales" are used interchangeably. 1 2 3 4 5 Each value is the number of units sold during the week. 6 7 8 9 10 11 12 13 14 885 15 16 17 18 19 20 21 22 23 24 25 26 27 28 29 30 31 32 33 34 35 36 37 38 39 40 41 42 Week 1 2 3 4 5 6 7 8 9 10 11 12 13 14 15 16 17 18 19 20 21 22 23 24 25 26 27 28 29 30 31 32 33 34 35 36 37 38 39 40 41 Sales Producti Sales Product2 455 832 490 798 425 890 466 855 456 848 454 871 476 838 465 826 481 853 463 870 483 849 440 888 445 859 452 894 447 873 440 888 459 863 460 424 912 447 913 397 878 386 916 366 888 357 931 367 888 372 883 336 871 327 873 328 891 354 826 352 830 394 822 378 820 410 850 441 854 422 835 436 835 424 883 461 826 474 842 484 856 43 44 45 47 48 49 50 51 52 53 54 55 56 57 58 59 60 61 62 63 64 65 66 67 68 69 70 42 43 44 45 46 47 48 49 50 51 52 53 54 55 56 57 58 59 60 61 62 63 64 65 66 67 68 69 498 526 517 504 503 483 497 475 493 506 513 506 486 498 487 453 503 491 455 501 501 450 455 495 452 493 494 477 510 842 808 875 901 915 8858 899 921 849 869 902 908 8872 930 844 899 8880 908 8898 893 863 907 877 847 901 858 860 823 795 71 70
Step by Step Solution
There are 3 Steps involved in it

Get step-by-step solutions from verified subject matter experts