

Question: This is your second interview with a prestigious brokerage firm for a job as an equity analyst. You survived the morning interviews with the department
This is your second interview with a prestigious brokerage firm for a job as an equity analyst. You survived the morning interviews with the department manager and the Vice President of Equity. Everything has gone so well that they want to test your ability as an analyst. You are seated in a room with a computer and a list with the names of two companies?Ford (F) and Microsoft (MSFT)
- For each of the four years of statements, compute the following ratios for each firm: Calculate the Enterprise Value for each firm. For consistency purposes use the following formula: Market Capitalization of Equity + Long-term Debt + Short-term Debt - Cash, Cash Equivalents and Short-Term Investments.
Valuation Ratios
Price-Earnings Ratio (for EPS use Diluted EPS Total) (Stock Price / EPS)
Market-to-Book Ratio (Market Capitalization / Book Value of Equity)
Profitability Ratios
Operating Margin(Operating profit/loss / Total Revenue)
Net Profit Margin(Net Income / Total Revenue)
Return on Equity(Net Income / Equity)
Financial Strength Ratios
Current Ratio(Current Assets / Current Liabilities)
Book Debt-Equity Ratio(Use Long-Term Debt)(LTD / BV of Equity)
Market Debt-Equity Ratio(Use Long-Term Debt)(LTD / MCAP)
Interest Coverage Ratio(Use Operating Income / Interest Expense Net of Capitalized Interest)(Interest / Operating Income)
2) Examine the Market-to-Book ratios you calculated for each firm. Which, if any, of the two firms can be considered "growth firms" and which, if any, can be considered "value firms"?
3) Compare the valuation ratios across the two firms. How do you interpret the difference between them?
4) Consider the enterprise value of each firm for each of the four years. How have the values of each firm changed over the time period?
5) In general, compare the ratios that you calculated for the two firms. Provide your overall evaluation of each highlighting strengths and weaknesses of each firm compared against the other.
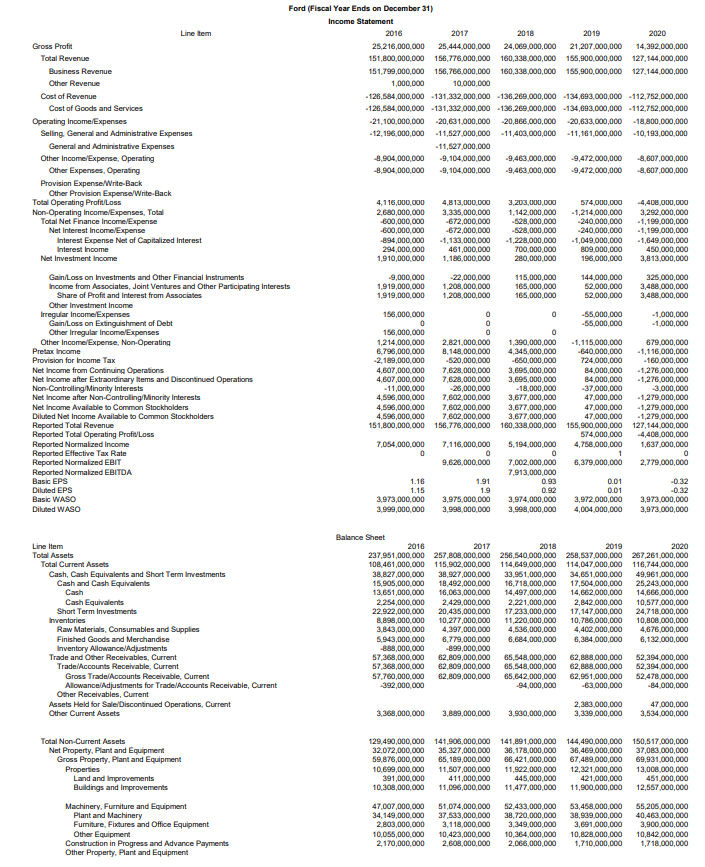
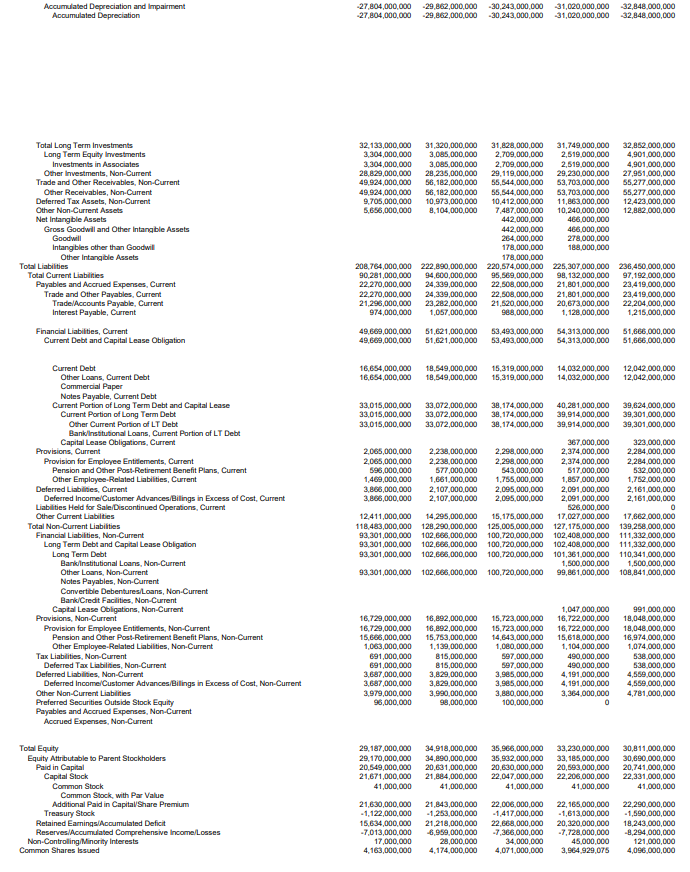
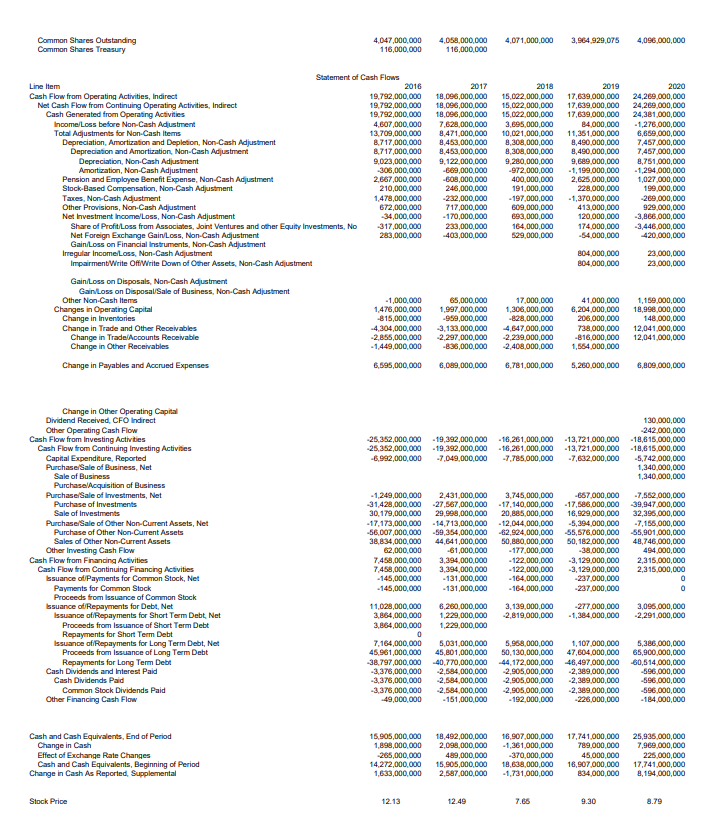
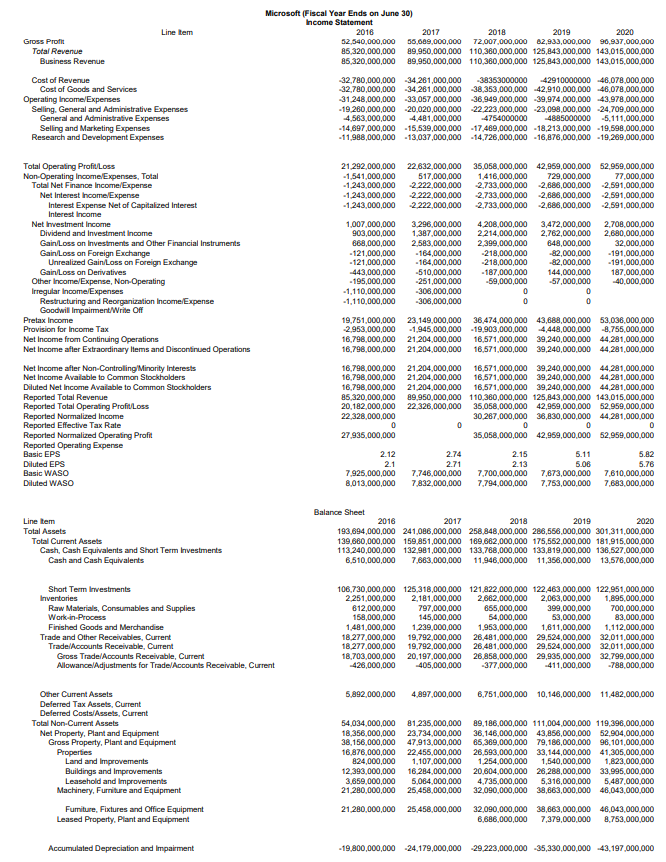
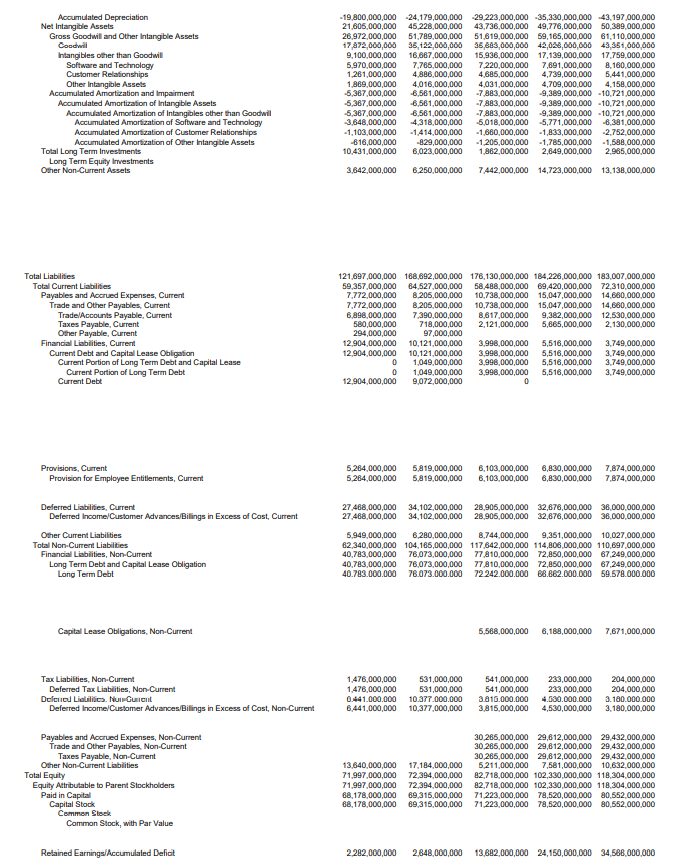
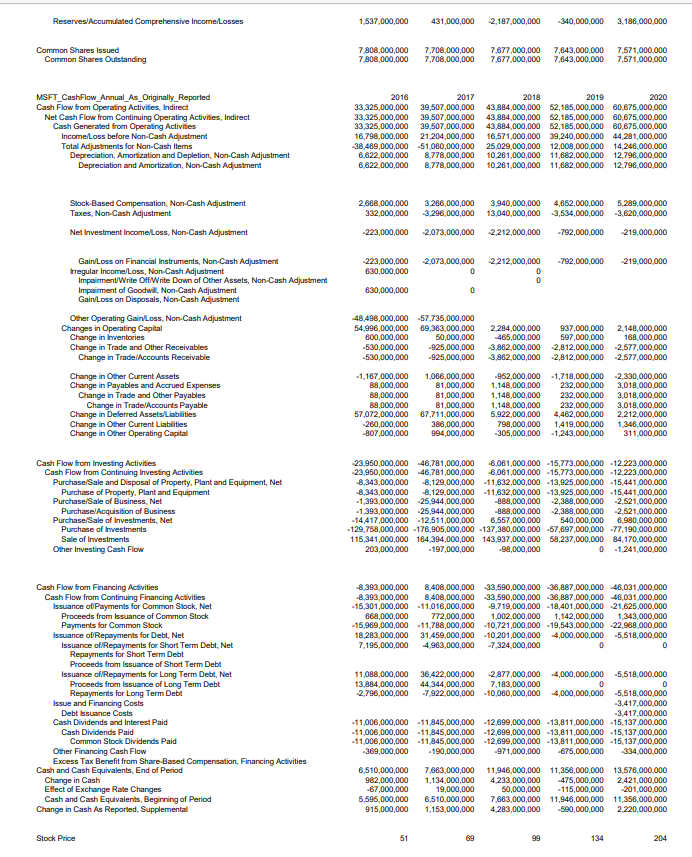
Ford (Fiscal Year Ends on December 31) Income Statement Line Item 2016 2017 2018 2019 2020 Gross Profit 25,216,000,000 25,444,000,000 24,069,000,000 21,207,000,000 14,392,000,000 Total Revenue 151,800,000,000 156,776,000,000 160,338,000,000 165,900,000,000 127,144,000,000 Business Revenue 151,799,000,000 156,766,000,000 160,338,000,000 165,900,000,000 127,144,000,000 Other Revenue 1,000,000 10.000,000 Cost of Revenue -126,684,000,000 -131,232,000,000 -136,269,000,000 -134,693,000,000 =112,752,000,000 Cost of Goods and Services 126,804,000,000 -131,232,000,000 -136,269,000,000 -134,693,000,000 -112,752,000,000 Operating Income Expenses 21,100,000,000 -20,631,000,000 -20,866 000,000 -20,633,000,000 -18,800,000,000 Selling, General and Administrative Expenses 12,196,000,000 -11,527,000,000 -11,403,000,000 .11,161,000,000 10,193,000,000 General and Administrative Expenses -11,627,000,000 Other Income Expense, Operating -4,904,000,000 -9, 104,000,000 -9,463,000,000 -9,472,000,000 -8 607,000,000 Other Expenses, Operating 8,904,000,000 -9, 104,000,000 -9,463 000,000 -9,472,000,000 8,607,000,000 Provision Expense.Write-Back Other Provision Expense/Write-Back Total Operating ProfitLoss 4,1 16,000,000 4,813,000,000 3,203,000,000 674,000,000 -4,408,000,000 Non-Operating Income Expenses, Total 2,680,000,000 4,235,000,000 1,142,000,000 1,214,000,000 3.292,000,000 Total Net Finance Income Expense 600,000,000 -672,000,000 -628,000,000 -240,000,000 -1,199,000,000 Net Interest Income Expense -600,000,000 -672,000,000 -628,000,000 -240,000,000 -1,199,000,000 Interest Expense Net of Capitalized Interest -894,000,000 1,133,000,000 1,228,000,000 1,049,000,000 1,649,000,000 Interest Income 294,000,000 461,000,000 700,000,000 809,000,000 480,000,000 Net Investment Income 1,910,000,000 1,186,000,000 280,000,000 196,000,000 3,813,000,000 Gain/Loss on Investments and Other Financial Instruments -9,000,000 -22,000,000 116,000,000 144 000,000 326,000,000 Income from Associates, Joint Ventures and Other Participating Interests 1,919,000,000 1,208,000,000 165,000,000 52,000,000 3,488,000,000 Share of Profit and Interest from Associates 1,919,000,000 1,208,000,000 165,000,000 52.000,000 3,488,000,000 Other Investment Income Irregular Income Expenses 156,000,000 -85,000,000 -1,000,000 Gain/Loss on Extinguishment of Debt -85,000,000 -1,000,000 Other Irregular Income Expenses 156,000,000 Other Income Expense, Non-Operating 1,214,000,000 2,821,000,000 1,240,000,000 1,115,000,000 679,000,000 Pretax Income 6,796,000,000 8,148,000,000 4,345,000,000 -640,000,000 1,116,000,000 Provision for Income Tax -2,189,000,000 -620,000,000 -680,000,000 724,000,000 -160,000,000 Net Income from Continuing Operations 4,607,000,000 7.628,000.000 3,695,000,000 84,000,000 1,276,000,000 Net Income after Extraordinary Items and Discontinued Operations 4,607,000,000 7,628,000,000 3,895,000,000 84,000,000 -1,276,000,000 Non-Controlling/Minority Interests -11,000,000 -26,000,000 -18,000,000 -37,000,000 -3,000,000 Net Income after Non-Controlling/Minority Interests 4,596,000,000 7,602 000,000 3,677,000,000 47,000,000 -1,279,000,000 Net Income Available to Common Stockholders 4,596,000,000 7,602 000,000 3,677 000,000 47,000,000 -1,279,000,000 Diluted Net Income Available to Common Stockholders 4,896,000,000 7,602,000,000 3,677,000,000 47,000,000 -1,279,000,000 Reported Total Revenue 151,800,000,000 156,776,000,000 160,338,000,000 155,900,000,000 127,144,000,000 Reported Total Operating Profit Loss 674,000,000 -4,408,000,000 Reported Normalized Income 7.054,000,000 7,1 16,000,000 5,194,000,000 4,780,000,000 1,637,000,000 Reported Effective Tax Rate Reported Normalized EBIT 9,626,000,000 7,002,000,000 6,379,000,000 2,779,000,000 Reported Normalized EBITDA 7,913,000,000 Basic EPS 1.10 191 0.93 0.01 Diluted EPS 1.15 1.9 0.92 -0.12 Basic WASO 3,973,000,000 3,975,000,000 3,974,000,000 3,972,000,000 3,973,000,000 Diluted WASO 3,999,000,000 3,998,000,000 3,898,000,000 4,004,000,000 3,973,000,000 Balance Sheet Line Hem 2016 2017 2018 2019 2020 Total Assets 237,951,000,000 257,808 000,000 256,840,000,000 258,637,000,000 267,261,000,000 Total Current Assets 108,461,000,000 1 15,902,000,000 1 14,649,000,000 114,047,000,000 116,744,000,000 Cash, Cash Equivalents and Short Term Investments 38,827,000,000 38,927,000,000 33,961,000,000 34,681,000,000 49,961,000,000 Cash and Cash Equivalents 16,905,000,000 18,492,000,000 16,718,000,000 17,804,000,000 25,243,000,000 Cash 13,651,000,000 16,063,000,000 14,497,000,000 14,862,000,000 14,686,000,000 Cash Equivalents 2,254,000,000 2,429 000,000 2,221,000,000 2,842 000,000 10,577,000,000 Short Term Investments 22,922,000,000 20,435,000,000 17,243,000,000 17,147,000,000 24,718,000,000 nventories 8,898,000,000 10,277,000,000 11,220,000,000 10,786,000,000 10,808,000,000 Raw Materials, Consumables and Supplies 3,843,000,000 4,397,000,000 4,636,000,000 4,402 000,000 4,676,000,000 Finished Goods and Merchandise 6.943,000,000 6,779.000.000 84 000,000 6,324 000,000 6,132,000,000 Inventory Allowance/Adjustments -808,000,000 -899,000,000 rade and Other Receivables, Current 57,368,000,000 62,809,000,000 65,648,000,000 62,884,000,000 52,394,000,000 Trade/Accounts Receivable, Current 57,368,000,000 62,809,000,000 65,848,000,000 62,808,000,000 62,394,000,000 Gross Trade/Accounts Receivable, Current 57,760,000,000 82,809,000,800 85,642.000,000 62,961 000,000 52,478,000,000 Allowance Adjustments for Trade/Accounts Receivable, Current -392,000,000 -94,000,000 -63,000,000 -84,000,000 Other Receivables, Current Assets Held for Sale Discontinued Operations, Current 2,383,000,000 47,000,000 Other Current Assets 3,368,000,000 3,849,000,000 3,930,000,000 3,209 000,000 3,534,000,000 Total Non-Current Assets 129,490,000,000 141,906,000,000 141,891,000,000 144,490,000,000 150,517,000,000 Jet Property, Plant and Equipment 32,072,000,000 35,327,000.000 36,178,000,000 36,489,000,000 37,083,000,000 Gross Property, Plant and Equipment 59,876,000,000 65, 189,000,000 66,421,000,000 67,489,000,000 69,931,000,000 Properties 10,899,000,000 11,807,000,000 11,922,000,000 12,321,000,000 13,008,000,000 Land and Improvements 391,000,000 411,000,000 445,000,000 421,000,000 481,000,000 Buildings and Improvements 10,308,000,000 11,096,000,000 11,477,000,000 11,900,000,000 12,567,000,000 Machinery, Furniture and Equipment 47,007,000,000 61,074,000,000 52,433,000,000 53,458,000,000 65,208,000,000 Plant and Machinery 34,149,000,000 37,633,000,000 38, 720,000,000 38,909 000,000 40,463,000,000 Fumiture, Fixtures and Office Equipment 2,803,000,000 3,1 18,000,000 3,349,000,000 3,691,000,000 3,900,000,000 Other Equipment 10,055,000,000 10,423,000,000 10,264 000,000 10,828,000,000 10,842,000,000 Construction in Progress and Advance Payments 2,170,000,000 2,608,000,000 2,066,000,000 1,710,000,000 1,718,000,000 Other Property, Plant and EquipmentAccumulated Depreciation and Impairment -27,804,000,000 -29,862,000,000 -30,243,000,000 -31,020,000,000 -32,848,000,00 Accumulated Depreciation -27,804,000,000 -29,862,000,000 -30,243,000,000 -31,020,000,000 -32,848,000,000 Total Long Term Investments 42, 133,000,000 31,320,000,000 31,828,000,000 31,749,000,000 32,862,000,000 Long Term Equity Investments 3,304,000,000 3,085,000,000 2,708,000,000 2,819,000,000 4,901,000,000 Investments in Associates 3,304,000,000 3,085,000,000 2,709,000,000 2,619 000,000 4,901,000,000 Other Investments, Non-Current 28,829,000,000 28,235,000,000 29.119,000,000 29,230,000,000 27,961,000,000 Trade and Other Receivables, Non-Current 49.924,000,000 56, 182,000,000 65,844,000,000 53,703,000,000 55,277 000,000 Other Receivables, Non-Current 49,924,000,000 56, 182,000,000 55,844,000,000 63,703 000,000 65,277,000,000 Deferred Tax Assets, Non-Current 9.705,000,000 10,973,000,000 10,412,000,000 11,863,000,000 12,423,000,000 Other Non-Current Assets 6,656,000,000 8,104,000,000 7,487,000,000 10,240,000,000 12,882,000,000 Net Intangible Assets 442,000,000 486,000,000 Gross Goodwill and Other Intangible Assets 442,000,000 486,000,000 Goodwill 264,000,000 278,000,000 Intangibles other than Goodwill 178,000,000 184,000,000 Other Intangible Assets 178,000,000 Total Liabilities 208,764,000,000 222,890 000.000 220,574.000,000 225,307,000,000 236,480,000,000 Total Current Liabilities 90,281,000,000 94.600,000,000 95,869,000,000 98, 132,000,000 97,192,000,000 Payables and Accrued Expenses, Current 22,270,000,000 24,209,000,000 22,508,000,000 21,801,000,000 23,419,000,000 Trade and Other Payables, Current 22,270,000,000 24,239,000,000 22,608,000,000 21,801,000,000 23,419,000,000 Trade/Accounts Payable, Current 21,296,000,000 23,282,000,000 21,620,000,000 20,673,000,000 22,204,000,000 Interest Payable, Current 974,000,000 1.057,000,000 948.000,000 1,128,000,000 1,216,000,000 Financial Liabilities, Current 49,869,000,000 51,621,000,000 63,492,000,000 54,313,000,000 51,686,000,000 Current Debt and Capital Lease Obligation 49,069,000,000 51,621,000,000 53,493,000,000 54,313,000,000 51,686,000,000 Current Debt 16,654,000,000 18,849,000,000 15,319,000,000 14,032,000,000 12,042,000,000 Other Loans, Current Debt 16,684,000,000 18,849,000,000 15,319,000,000 14,032 000,000 12,042,000,000 Commercial Paper Notes Payable, Current Debt Current Portion of Long Term Debt and Capital Lease 33,015,000,000 33,072,000,000 38, 174,000,000 40,281,000,000 39,624,000,000 Current Portion of Long Term Debt 93,015,000,000 33,072,000,000 38, 174,000,000 39,914,000,000 39,301,000,000 Other Current Portion of LT Debt 43,015,000,000 33,072,000,000 38, 174 000,000 39,914.000,000 39,301,000,000 Bank/Institutional Loans, Current Portion of LT Debt Capital Lease Obligations, Current 367,000,000 323,000,000 Provisions, Current 2,065,000,000 2,238,000,000 2,298,000,000 2,374,000,000 2,284,000,000 Provision for Employee Entitlements, Current 2065,000,000 2.238,000,000 2 290,000,000 2.374 000,000 2,284,000,000 Pension and Other Post-Retirement Benefit Plans, Current 896,000,000 677,000,000 842,000,000 $17,000,000 632,000,000 Other Employee-Related Liabilities, Current 1,469,000,000 1,861,000,000 1,785,000,000 1,867,000,000 1,762,000,000 Deferred Liabilities, Current 3,806,000,000 2.107 000,000 2,095,000,000 2,091,000,000 2,161,000,000 Deferred Income Customer Advances/Billings in Excess of Cost, Current 3,806,000,000 2,107 000,000 2,095,000,000 2,091,000,000 2,161,000,000 Liabilities Held for Sale Discontinued Operations, Current 826,000,000 Other Current Liabilities 12,411,000,000 14,295,000,000 15,175,000,000 17,027,000,000 17,662,000,000 Total Non-Current Liabilities 118,483,000,000 128,290,000,000 125,005,000,000 127,175,000,000 139,288,000,000 Financial Liabilities, Non-Current 93,301,000,000 102,606,000.000 100,720,000,000 102,408,000,000 111,332,000,000 Long Term Debt and Capital Lease Obligation 93,301,000,000 102,606,000,000 100,720,000,000 102,408,000,000 111,332,000,000 Long Term Debt 93,301,000,000 102,646 000,000 100,720,000,000 101,361,000,000 110,341,000,000 Bank/Institutional Loans, Non-Current 1,800 000,000 1,500,000,000 Other Loans, Non-Current 93,301,000,000 102,866,000,000 100,720,000,000 99,861,000,000 108,841,000,000 Notes Payables, Non-Current Convertible Debentures/Loans, Non-Current Bank Credit Facilities, Non-Current Capital Lease Obligations, Non-Current 1,047,000,000 991,000,000 Provisions, Non-Current 16,729,000,000 16,892,000,000 15,723,000,000 16,722,000,000 18,048,000,000 Provision for Employee Entitlements, Non-Current 16,729,000,000 16,892,000,000 15,723,000,000 16,722,000,000 18,048,000,000 Pension and Other Post-Retirement Benefit Plans, Non-Current 16,606,000,000 15,763,000,000 14,643,000,000 15,618,000,000 16,974,000,000 Other Employee-Related Liabilities, Non-Current 1,063,000,000 1,139,000,000 1,080,000,000 1,104,000,000 1,074,000,000 Tax Liabilities, Non-Current 691,000,000 815,000,000 897,000,000 490,000,000 538,000,000 Deferred Tax Liabilities, Non-Current 691,000,000 815,000,000 897,000,000 490,000,000 538,000,000 Deferred Liabilities, Non-Current 3,687,000,000 3,829,000,000 3,985,000,000 4, 191,000,000 4,589,000,000 Deferred Income Customer Advances/Billings in Excess of Cost, Non-Current 3,687,000,000 3,829,000,000 3,985,000,000 4, 191,000,000 4,589,000,000 Other Non-Current Liabilities 3,979,000,000 3,290,000,000 1.820 000,000 3,264 000,000 4,781,000,000 Preferred Securities Outside Stock Equity 96,000,000 98,000,000 100 000,000 Payables and Accrued Expenses, Non-Current Accrued Expenses, Non-Current Total Equity 29,187,000,000 34,918,000,000 35,906,000,000 33,230,000,000 30,811,000,000 Equity Attributable to Parent Stockholders 29,170,000,000 34,890,000,000 35 902 000,000 33, 185,000,000 30,690,000,000 Paid in Capital 20,849,000,000 20,631,000,000 20,630 000,000 20,893 000,000 20,741,000,000 Capital Stock 21,671,000,000 21,884,000,000 22,047,000,000 22,206,000,000 22,331,000,000 Common Stock 41,000,000 41,000,000 41,000,000 41,000,009 41,000,000 Common Stock, with Par Value Additional Paid in Capital/ Share Premium 21,630,000,000 21,843,000,000 22,006,000,000 22, 165,000,000 22,290,000,000 Treasury Stock -1,122,000,000 -1,253,000,000 -1,417,000,000 -1,613,000,000 -1,590,000,000 Retained Earnings/Accumulated Deficit 16,634,000,000 21,218,000,000 22,668,000,000 20,320,000,000 18,243,000,000 Reserves/Accumulated Comprehensive Income/Losses -7,013,000,000 6.959,000,000 7.386 000,000 -7,728,000,000 8,294,000,000 Non-Controlling Minority Interests 17,000,000 28,000,000 34 000,000 45,000,000 121,000,000 Common Shares Issued 4.163,0001000 4,174 000.000 4,071,000,000 3,904 929 075 4,096,000,000Common Shares Outstanding 4,047,000,000 4,058,000,000 4,071,000,000 3,904,929.076 4,096,000,000 Common Shares Treasury 116,000,000 1 16,000,000 Statement of Cash Flows Line Hem 2016 2017 2018 2018 2020 Cash Flow from Operating Activities, Indirect 19,792,000,000 18,096,000,000 15,022 000,000 17,639,000,000 24,269,000,000 Net Cash Flow from Continuing Operating Activities, Indirect 19,792,000,000 18,096,000,000 15,022,000,000 17,639,000,000 24,269,000,000 Cash Generated from Operating Activities 19,792,000,000 18,096,000,000 15,022 000,000 17,639 000,000 24,381,000,000 Income/Loss before Non-Cash Adjustment 4,607,000,000 7,628,000,000 3,695,000,000 84,000,000 -1,276.000,000 Total Adjustments for Non-Cash Items 13,709,000,000 8,471,000,000 10,021 000,000 11,361,000,000 6,689,000,000 Depreciation, Amortization and Depletion, Non-Cash Adjustment 8,717,000,000 8,453,000,000 8,308,000,000 8,490,000,000 7,467 000,000 Depreciation and Amortization, Non-Cash Adjustment 8,717,000,000 8,453,000,000 8,308,000,000 8,490,000,000 7,467 000,000 Depreciation, Non-Cash Adjustment 9.023,000,000 9,122,000,000 9.280,000,000 9,689,000,000 8,761,000,000 Amortization, Non-Cash Adjustment -306,000,000 -$69,000,000 -972,000,000 -1,199,000,000 1,294,000,000 Pension and Employee Benefit Expense, Non-Cash Adjustment 2,667,000,000 -608,000,000 400,000,000 2,626 000,000 1,027,000,000 Stock-Based Compensation, Non-Cash Adjustment 210,000,000 246,000,000 191,000,000 228,000,000 199,000,000 Taxes, Non-Cash Adjustment 1,478,000,000 232,000,000 -197,000,000 1,370,000,000 -269,000,000 Other Provisions, Non-Cash Adjustment 672,000,000 717,000,000 609,000,000 413,000,000 929,000,000 Yet Investment Income Loss, Non-Cash Adjustment -34,000,000 -170,000,000 693,000,000 120,000,000 -3,866,000,000 Share of ProfitiLoss from Associates, Joint Ventures and other Equity Investments, No -317,000,000 233,000,000 164,000,000 174,000,000 3,446,000,000 Net Foreign Exchange Gain/Loss, Non-Cash Adjustment 283,000,000 -403,000,000 629,000,000 -84,000,000 420,000,000 GainLoss on Financial Instruments, Non-Cash Adjustment Irregular Income Loss, Non-Cash Adjustment 804,000,000 23,000,000 ImpairmentWrite OffWrite Down of Other Assets, Non-Cash Adjustment 804,000,000 20,000,000 Gain Loss on Disposals, Non-Cash Adjustment Gain Loss on Disposal Sale of Business, Non-Cash Adjustment Other Non-Cash Hems -1,000.000 65,000.000 17,000,600 41,000,000 1,189 000,000 Changes in Operating Capital 1,476,000,000 1,997,000,000 1,306,000,000 6,204,000,000 18,998,000,000 Change in Inventories -815,000,000 -959,000,000 -828,000,000 206,000,000 148,000,000 Change in Trade and Other Receivables -4,304,000,000 3,133,000,000 -4,647,000,000 728,000,000 12,041,000,000 Change in Trade Accounts Receivable -2,855,000,000 2,297,000,000 -2,209,000,000 -816,000,000 12,041,000,000 Change in Other Receivables -1,449,000,000 -836,000,000 2,408,000,000 1,684,000,000 Change in Payables and Accrued Expenses 6,895,000,000 6,089,000,000 6,781,000,000 5,260,000,000 6,809,000,000 Change in Other Operating Capital Dividend Received, CFO Indirect 130,000,000 Other Operating Cash Flow -242 000,000 Cash Flow from Investing Activities -26,352,000,000 -19,392,000,000 -16,261,000,000 -13,721,000,000 -18,616,000,000 Cash Flow from Continuing Investing Activities -26,352,000,000 -19,392,000,000 -16,261,000,000 -13,721,000,000 -18,616,000,000 Capital Expenditure, Reported -6,992,000,000 -7,049,000,000 -7,785,000,000 -7,632,000,000 -5,742,000,000 Purchase Sale of Business, Ne 1,340,000,000 Sale of Business 1,340.000,000 Purchase Acquisition of Business Purchase Sale of Imrestments, Net -1,249,000,000 2,431,000,000 3,745 000,000 -687.000,000 -7,562,000,000 Purchase of Investments 31,428,000,000 27,867,000,000 17,140,000,000 17,806,000,000 -39,947,000,000 Sale of Investments 30,179,000,000 29,998,000,000 20,885,000,000 16,929,000,000 32,396,000,000 Purchase Sale of Other Non-Current Assets, Net -17,173,000,000 -14,713,000,000 -12,044,000,000 -5,394,000,000 -7,186,000,000 Purchase of Other Non-Current Assets -56,007,000,000 -59,354,000,000 -62,924,000,000 -55,676,000,000 55,901,000,000 Sales of Other Non-Current Assets 38,834,000,00 44,641,000,00 50,280,000,000 50, 182,000,000 48,746,000,000 Other Investing Cash Flow 62,000,000 -61,000,000 -177,000,000 -18,000,000 494,000,000 Cash Flow from Financing Activities 7,458,000,000 3,394,000.000 -122,000,000 3, 129,000,000 2,318,000,000 Cash Flow from Continuing Financing Activities 7,458,000,000 3,394 000,000 -122 000,000 3,129,000,000 2,318,000,000 Issuance of Payments for Common Stock, Net -145,000,000 -131,000,000 -164,000,000 247,000,000 Payments for Common Stock -145,000,000 -131,000,000 -164,000,000 237,000,000 Proceeds from Issuance of Common Stock suance of Repayments for Debt, Net 11,028,000,000 6,260,000,000 3.139,000,000 -277,000,000 3,096,000,000 Issuance of Repayments for Short Term Debt, Net 3,864,000,000 1,229,000,000 -2,819.000,000 1,384,000,000 -2,291,000,000 Proceeds from Issuance of Short Term Debt 3,864,000,000 1,229,000,000 Repayments for Short Term Debt ssuance offRepayments for Long Term Debt, Net 7,164,000,000 6.021,000,000 5,908.000,000 1,107,000,000 6,386,000,000 Proceeds from Issuance of Long Term Debt 46,961,000,000 45,801,000,000 50,130 000,000 47,804,000,000 65,900.000,000 Repayments for Long Term Debt -38,797,000,000 -40,770,000,000 44,172,000,000 -46,497,000,000 60.514,000,000 ash Dividends and Interest Paid -3,376,000,000 -2,804 000,000 -2,905,000,000 -2,389.000,000 -596,000,000 Cash Dividends Paid -3,376,000,000 -2,604,000,000 2,905,000,000 -2,389,000,000 -596,000,000 Common Stock Dividends Paid -3,376,000,000 2.684,000,000 2,905,000,000 2.309,000,000 -596,000,000 Other Financing Cash Flow -49,000,000 -151,000,000 -192 000,000 -226 000,000 -184,000,000 Cash and Cash Equivalents, End of Period 16,905,000,000 18,492,000,000 16,907,000,000 17,741,000,000 25,936,000,000 Change in Cash 1,898,000,000 2,098,000,000 -1,361,000,000 789.000,000 7,909 000,000 Effect of Exchange Rate Changes -265,000,000 489,000,000 -370,000,000 45,000,000 226,000,000 Cash and Cash Equivalents, Beginning of Period 14,272,000,000 15,905,000,000 18,638,000,000 16,907,000,000 17,741,000,000 Change in Cash As Reported, Supplemental 1,633,000,000 2,887,000,000 -1,731,000,000 834,000,000 8, 194,000,000 Stock Price 12.12 12.49 9.30 8.79Microsoft (Fiscal Year Ends on June 30) Income Statement Line Item 2018 2017 2018 2019 2020 Gross Profit 62,540,000,000 86,689,000,000 72007 000,000 82,933,000,000 90,937,000,000 Total Revenue 85,320,000,000 89,950,000,000 110,380,000,000 125,843,000,000 143,015,000,000 Business Revenue 85,320,060,060 89,950,000,000 110,380,000,000 125,843,000,000 143,015,000,000 Cost of Revenue 32,780,060,060 -34 281,000,000 -18353060000 42910000000 -48,078,000,000 Cost of Goods and Services -32,780,060,000 -34,281,060,000 -38,353,000,000 -42,910,000,000 -48,078 000,000 Operating Income Expenses -31,248,000,000 -33,057,000,000 -36,949,000,000 -39,974,000,000 -43,978,000,000 Selling, General and Administrative Expenses -19,280,000,000 -20,020,000,060 -22 223,000,000 -23,098,000,000 -24,709,000,000 General and Administrative Expenses 4,583,000,000 4,481,000,000 -4764060000 4885000600 -6,111,000,000 Selling and Marketing Expenses -14,697,000,000 -16,539,000,000 -17 489,000,000 1 -18,213,000,000 -19,698,000,000 Research and Development Expenses -11,908,000,000 -13,037,060,000 -14,726,000,000 =16,876,000,000 -19,269,000,000 Total Operating Profit/Loss 21,292,000,000 22,632,000,000 35,058,000,000 42,969,000,000 52,959,000,000 Jon-Operating Income Expenses, Total -1,541,000,000 617,060,060 1,416,000,000 728,000,000 77,000,000 Total Net Finance Income Expense -1,243,000,000 2,222 000,000 -2,730,000,000 -2,806,000,000 -2,591,000,000 Net Interest Income Expense -1,243,000,000 2 222,000,000 2,723,000,000 -2,806,000,000 -2.691,000,000 Interest Expense Net of Capitalized Interest -1,243,000,000 2 222 060,000 2,733,000,000 -2,806,000,000 -2.691,000.000 Interest Income Net Investment Income 1,007,000,000 3,296,000,000 4,208,000,000 3,472,000,000 2,708,000,000 Dividend and Investment Income 903,000,000 1,387,000,000 2,214 060,000 2,762,000,000 2.680,000 000 Gain/Loss on Investments and Other Financial Instruments 868,000,000 2.583,000,000 2,399,000,000 848,000,000 32,000,000 Gain/Loss on Foreign Exchange 121,000,000 -164,000,000 -218,000,000 -82,600.600 -191,000.000 Unrealized Gain Loss on Foreign Exchange -121,000,000 -164,000,000 218,000,000 -82,000,000 -191,000,000 Gain/Loss on Derivatives 443,000,000 -610,000,000 -187,000,000 144,000,000 187,000,000 Other Income Expense, Non-Operating -195,000,00 -251,000,000 -69,000,000 -57,000,000 -40,000,000 Irregular Income/Expenses 1,110,000,000 -306,000,000 Restructuring and Reorganization Income Expense -1,110,000,000 $306,000,000 Goodwill Impairment/Write Off Pretax Income 19,751,000,000 23,149,000,000 36,474,000,000 43,868,000,000 53,038,000,000 Provision for Income Tax 2,953 000,000 -1,945,000,000 -19 903,000,000 4,448,000,000 -8,755,000,000 Net Income from Continuing Operations 16,796,000,000 21 204,000,000 16,571,000,000 39,240,000,000 44,281,000,000 Net Income after Extraordinary Items and Discontinued Operations 16,796,000,000 21,204,000,000 16,571,000,060 39,240,000,000 44,281,000,000 Net Income after Non-Controlling Minority Interests 16,798,000,060 21,204,000,000 16,571,000,000 39,240,000,000 44,281,000,000 Net Income Available to Common Stockholders 16,796,000,000 21 204,000,000 16,571,000,060 39,240,000,000 1 44,281,000 000 Diluted Net Income Available to Common Stockholders 16,796,000,000 21 204,000,000 16,571,000,000 39,240,000,000 44,281,000,000 Reported Total Revenue 85,320,000,000 89 950 000,000 110,380,000,000 125,843,000,600 143,015,000,000 Reported Total Operating Profit/Loss 20,102,000,000 22 326 000,000 15,058,000,000 1 42,969,000,000 52,959,000,000 Reported Normalized Income 22,328,000,060 30,287,000,000 36,830,000,000 44,281,006,000 Reported Effective Tax Rate Reported Normalized Operating Profit 27,935,000,000 35,058,000,000 42,969,000,000 52,959,000,000 Reported Operating Expense Basic EPS 2.12 2.74 2.15 5.11 5.12 Diluted EP3 21 271 2.13 5.08 5.76 Basic WASO 7.926,000,000 7.746,000,000 7,700,000,000 7.873,000,000 7,610,000,000 Diluted WASO 8,013.000,000 7.832 000,000 7,794 000,000 7,763,000,000 7.683,000,000 Balance Sheet Line Item 2016 2017 2018 2019 2020 Total Assets 190,694,000,000 241,086,000,000 250,848,000,000 286,556,000,000 301,311,000,000 Total Current Assets 139 680,000,000 159.851,000,000 189.682,000,000 175,562,000,000 181,915,000,000 Cash, Cash Equivalents and Short Term Investments 113,240,000,000 132,981,000,000 133,788,000,000 133,819,000,000 138,527,000,000 Cash and Cash Equivalents 6,510,000,000 7,683,000,000 11,946,000,000 11,356,000,000 13,576,000,000 Short Term Investments 106,730,000,000 125,318,000,000 121,822,000,000 122,463,000,000 122,951,000,000 Inventories 2,251,000,000 2,181,000,060 2 682,000,000 2,063,000,000 1,895,000,000 Raw Materials, Consumables and Supplies 812,000,000 797,000,060 865,000,000 399,600 000 700.006 000 Work-in-Process 168,000,000 145,000,000 54,000,000 53,000,000 83,000,000 Finished Goods and Merchandise 1,481,000,000 1,239,000,000 1,953,000,000 1,811,000,000 1,112,000,000 Trade and Other Receivables, Current 18,277.000,060 19,792,060,000 26,401,000,000 29,524,000,000 32,011,000,000 Trade/Accounts Receivable, Current 18,277,000,000 19,792,000,000 26,481,000,000 29,524,000,000 32,011,000,000 Gross Trade/Accounts Receivable, Current 12 703 000,000 20 197.000,000 26,850,000,000 29,905,000,000 32,799,000,000 Allowance/Adjustments for Trade/Accounts Receivable, Current -426,000,060 -405,000,000 -377,060,000 -411,000,000 708,000,000 Other Current Assets 5,892,000,000 4,897,000,000 6,751,000,000 10,146,000,000 11,482,000,000 Deferred Tax Assets, Current Deferred Costs/Assets, Current Total Non-Current Assets 54,034,000,000 81 235,000,000 89,186,000,000 111,004,000,000 119,398,000,000 Net Property, Plant and Equipment 18,356 000,000 23 734 000,000 36,146,000,000 43,856,000,000 52,904,000,000 Gross Property, Plant and Equipment 38,156,000,000 47,913,000,000 86,389,000,000 79,186,000,000 98,101,000,000 Properties 16,876,000,000 22 456,000,000 26,593,000,000 33,144,000,000 41,205,000,000 Land and Improvements 824,000,060 1,107,000,060 1,254,000,000 1,540,000,600 1,823,006,000 Buildings and Improvements 12,393,000,000 16,284,000,000 20,604,000,000 26,288,000,000 33,995,000,000 Leasehold and Improvements 3.659 000,000 5.084,000,060 4,735,000,000 5,316,000,000 6,487,000,000 Machinery, Fumiture and Equipment 21 280,000,060 26,458,000,000 32 090,000,000 38,863,000,000 46,043,000,000 Fumiture, Fixtures and Office Equipment 21 280,000,000 26,458,000,000 32,090,000,000 38,863,000.000 46,043,000,000 Leased Property, Plant and Equipment 6,686,000,000 7,379,000,000 8,753,000,000 Accumulated Depreciation and Impairment -19,800,000,000 -24,179,000,000 -29,223,000,000 -35,330,000,000 -43,197,000,000Accumulated Depreciation -19,800,000,000 -24,179,000,000 -29,223,000,000 -35,330,000,000 43,197,000,000 Net Intangible Assets 21,606,000,000 45,228,000,000 43,736,000,000 49,776,600,000 50,209,000,000 Gross Goodwill and Other Intangible Assets 26.972.000,000 61,789,000,000 51 619,000,000 69,165,000,000 61,110,000,000 17 872 065,868 35 124,060,060 46 845 060,868 42,848,806,808 44,351,606,606 htangibles other than Goodwill 9.100.000,000 16.687.000,000 15.936,000,000 17,139,000,000 17,759,000,000 Software and Technology 5,970,000,000 7,785,000,000 7 220,000,000 7,891,000,000 8,160,000.000 Customer Relationships 1,281,000,000 4,806,000,000 4,685,000,000 4,739,000.000 6,441,000,000 Other Intangible Assets 1,889,000,000 4,016,060,060 4,031,000,060 4,709,000,000 4,158,006,000 Accumulated Amortization and Impairment -5,387,000,000 6,561,000,000 -7.883,060,000 -9,389,000.000 -10.721,000,000 Accumulated Amortization of Intangible Assets -5,387,000,000 6.581,000,000 -7 803 000,000 -9,389,000,000 -10,721,000,000 Accumulated Amortization of Intangibles other than Goodwill -5,387.000,000 -6,581,060,000 -7.803,060,060 -9,389,000,000 -10,721,006,000 Accumulated Amortization of Software and Technology -3,648,000,000 4,318,000,000 -5,018,000,000 -5,771,000,000 -6,381,000,000 Accumulated Amortization of Customer Relationships 1,103,000,000 -1,414,000,000 -1,680,000,000 -1,833,000,000 -2,752,000,000 Accumulated Amortization of Other Intangible Assets -616,000,000 -829,000,000 -1,206,000,000 -1,785,000,000 -1,608,006,000 Total Long Term Investments 10,431,000,000 6.023,000,000 1,882,000,000 2,849,000,000 2,965,000,000 Long Term Equity Investments Other Non-Current Assets 3,642 000,000 6,250,000,000 7,442,000,000 14,723,000,000 13,138,000,000 Total Liabilities 121,697,000,000 188,692,000,000 176,130,000,000 184,226,000,000 183,007,000,000 Total Current Liabilities 59,357,060,000 84,527,000,000 68,408,000,000 69,420,000,000 72,310,000,000 Payables and Accrued Expenses, Current 7,772,000,000 8 205,000,000 10,738,060,000 15,047,000,000 14,660,000,000 Trade and Other Payables, Current 7,772,000,000 8,206,000,000 10,738,000,000 15,047,000.000 14,680,000,000 Trade/Accounts Payable, Current 6,898,000,000 7 390.000,000 8,617,000,060 9,382,600,000 12,530,006,000 Taxes Payable, Current 580,000,000 718,000,000 2.121,060,000 5,865,000,000 2,130,000,000 Other Payable, Current 294,000,000 97,000,000 Financial Liabilities, Current 12,904,000,000 10,121,060,000 3,990 000,000 5,616,000,000 3,749,000,000 Current Debt and Capital Lease Obligation 12,904,000,000 10,121,000,000 3.990,000,000 5,516,000,000 3,749,000,000 Current Portion of Long Term Debt and Capital Lease 1 049.000,000 3.998,000,000 5,516,000,000 3,749,000,000 Current Portion of Long Term Debt 1,049,060,000 3,990,000,000 5,516,000,000 3,749,000,000 Current Debt 12,904,000,000 9,072,000,000 Provisions, Current 5,284,000,000 6,819,000,000 6,103,000,000 6,830,000,000 7.874,000,000 Provision for Employee Entitlements, Current 5,284,000,000 5,819,000,000 6,103,000,000 6,830,600,000 7,874,000,000 Deferred Liabilities, Current 27 488,000,000 34.102 000,000 28,906,000,000 32,876,000,000 38.000,000.000 Deferred Income/Customer Advances/Billings in Excess of Cost, Current 27 468,000,000 34,102,060,000 28,906,060,000 32,876,000,000 38,000,000,000 Other Current Liabilities 5,949,000,000 6 280.000,000 8,744,000,000 9,351,000,000 10.027,000.000 Total Non-Current Liabilities 82,340,000,000 104,185,000,000 117,642,000,000 114,806,000,000 110,697,000,000 Financial Liabilities, Non-Current 40,783,000,000 76,073,000,000 77,810.000,000 72,850,000,000 67,249,000,000 Long Term Debi and Capital Lease Obligation 40,783,000,000 76.073.000,000 77 810,000,000 72,850,000,000 67,249,000,000 Long Term Debt 40.783.000.060 78.073 060.060 72 242.000.060 68.862.600.600 59.578.0061000 Capital Lease Obligations, Non-Current 6,568,000,000 6,188,000,000 7.671,000,000 Tax Liabilities, Non-Current 1,476,000,000 531,000,000 541,000,000 2:33,600,000 204,000,000 Deferred Tax Liabilities, Non-Current 1,476,000,000 531,060,000 641,000,000 233,000,000 204,000,000 Defened Liabilities. Non Current 0.441 060.060 10.377 000.060 3.816.060.060 4.560.601.600 3.180.006.000 Deferred Income/Customer Advances/Bilings in Excess of Cost, Non-Current 6,441,000,000 10 377.000,000 3.815,000,060 4,530,000,000 3,180,000,000 Payables and Accrued Expenses, Non-Current 30 286,000,000 29,612,000,000 29.432,000,000 Trade and Other Payables, Non-Current 30,286,000,000 29,812,000,000 29,432,000,000 Taxes Payable, Non-Current 30 285,000,000 29,812,000,000 29.432,000,000 Other Non-Current Liabilities 13,640,000,000 17,184,000,000 5,211,000,000 7,501,000,000 10,632,000,000 Total Equity 71,997,000,000 72,394,000,000 82,718,000,000 102,330,000,000 118,304,006,000 Equity Attributable to Parent Stockholders 71,997,000,000 72 394,000,000 82,718,000,000 102,330,000,000 118,304,000,000 Paid in Capital 68,178,000,000 89,315,000,000 71,223,000,000 78,520,000,000 80,652,000,000 Capital Stock 88,178,000,000 69,315,000,000 71,223,000,000 78,520,000,000 80,652,000,000 Common Stock Common Stock, with Par Value Relained Earnings/Accumulated Deficit 2,282 060,000 2,648,000,000 13 802,000,000 24,150,000,000 34,568,000,000Reserves/Accumulated Comprehensive Income Losses 1,537,000,000 431,000,000 -2,187 060,060 -340,000,000 3.186,000,000 Common Shares Issued 7,808,000,000 7.708,000,000 7,677.000,000 7,843,000,000 7.571,000,000 Common Shares Outstanding 7,808,000,000 7,708,000,000 7,677.060,060 7,843,000,000 7,571,000,000 MSFT_CashFlow_Annual_As_Originally_Reported 2016 2017 2018 2019 2020 Cash Flow from Operating Activities, Indirect 33,325 000,000 39.507,000,000 43,884 060,060 62,185,000,000 60.675,000,000 Net Cash Flow from Continuing Operating Activities, Indirect 33,325,000,000 39.507,000,000 43.804 000,060 62,185,000,000 60.676,000,000 Cash Generated from Operating Activities 33,325,000,000 39.507,000,000 43 884 000,000 52,185,000,000 60,675,000,000 Income Loss before Non-Cash Adjustment 16,798,000,000 21 204,000,000 16 571,000,000 39,240,000,000 44,281,000,000 Total Adjustments for Non-Cash Hems 38,489,000,000 51,080,000,000 26,029,000,000 12,008,000,000 14,248,000.000 Depreciation, Amortization and Depletion, Non-Cash Adjustment 6,622,000,000 8,778,000,000 10,281,000,000 11,882,000,000 12,798,000,000 Depreciation and Amortization, Non-Cash Adjustment 6,622,000,000 8,778,000,000 10,281,060,000 11,862,000.000 12,798,000,000 Stock-Based Compensation, Non-Cash Adjustment 2 688,000,000 3.286.000,000 3.940 060,060 4,862,000,000 5.289,000,000 Taxes, Non-Cash Adjustment 332,000,000 1,296,000,000 13 040 060,060 3,634,000,000 -3,620,000,000 Nel Investment Income Loss, Non-Cash Adjustment 223,000,000 -2,073,000,000 2 212,000,000 -792,000.000 219,000,000 Gain/Loss on Financial Instruments, Non-Cash Adjustment 223,000,000 2,073,000,000 -2 212,000,000 -792,000,000 219,000,000 Irregular Income/Loss, Non-Cash Adjustment 830,000,000 Impairment/Write Off/Write Down of Other Assets, Non-Cash Adjustment Impairment of Goodwill, Non-Cash Adjustment 830,000,000 Gain/Loss on Disposals, Non-Cash Adjustment Other Operating Gain Loss, Non-Cash Adjustment 48,498,000,000 -57,735,000,000 Changes in Operating Capital 64.996 000,000 89 383,000,000 2 284 000,000 907,000,000 2,148,000,000 Change in Inventories 800,000,000 50,000,000 -465,000,000 597,000,000 168,000,000 Change in Trade and Other Receivables 530,000,000 925,000,000 -3,882 000,000 -2,812,000,000 -2,577,000,000 Change in TradeMAccounts Receivable -530,000,000 -925,000,000 3 882,060,000 2,812,600,000 -2,577,000,000 Change in Other Current Assets -1,187 000,000 1,086.000,000 -952,000,000 -1,718,000,000 .2.130,000,000 Change in Payables and Accrued Expenses 88,000,000 81,000,000 1,148,000,000 242,000,000 3,018,000,000 Change in Trade and Other Payables 88,060 000 31,000,000 1,148,000,000 232,000,000 3,018,000,000 Change in Trade/Accounts Payable 88,060,000 81,000,000 1,148,000,000 232,000,000 3,018,000,000 Change in Deferred Assets Liabilities 57,072,000,000 87.711,000,000 5.922,000,000 4,462,000,000 2,212,000,000 Change in Other Current Liabilities .260,000,000 386,000,000 798,000,060 1,419,000,000 1,346,000,000 Change in Other Operating Capital -807,000,000 994,000,000 305,060,000 -1,243,000,000 311,000,000 Cash Flow from Investing Activities -23,950,000,000 46,781,000,000 -6,081,000,000 -15,773,000,000 -12,223,000,000 Cash Flow from Continuing Investing Activities 23,950,000,000 46,781,000,000 -6,081,000,000 -15,773,000,000 -12,223,000,000 Purchase/Sale and Disposal of Property, Plant and Equipment, Net -8,343,000,000 -8,129,000,000 -11,632,000,000 -13,925,000,000 -15,441,000,000 Purchase of Property, Plant and Equipment -8,343,000,000 -8,129,000,060 -11,632,000,000 -13,925,000,000 -15,441,000,000 Purchase/Sale of Business, Net -1,393,000,000 26,944,000,000 -868,000,000 -2,388,000,000 -2,521,000,000 Purchase/Acquisition of Business -1,393,000,000 -25,944,000,000 -080,000,000 2,388,000,000 -2,521,000,000 Purchase/Sale of Investments, Net -14,417,000,000 -12,511,000,000 6,557,000,000 540,000,000 8,980,000,000 Purchase of Investments -129,758,000,000 -176,905,000,000 -137 380,000,000 -57,897,000,000 -77,190,000,000 Sale of Investments 115,341,000,000 184 394,000,000 143.937.000,000 68,237,000,000 84,170,000,000 Other Investing Cash Flow 203,000,000 -197,060,000 -90,000,000 -1,241,000,000 Cash Flow from Financing Activities 8,390,000,000 8,408,000,000 -33,590,000,000 -36,087,000,000 -48,031,000,000 Cash Flow from Continuing Financing Activities -8,390,000,000 8,408,000,000 13.590,000,000 -16,087,000,000 -48,031,006,000 Issuance of Payments for Common Stock, Net 15,301,000,000 -11,016,000,000 -9,719.000,000 -18,401,000,000 -21,625,000,000 Proceeds from Issuance of Common Stock 868,000,000 772,000,060 1.002 060,060 1,142,000,000 1,343,000,000 Payments for Common Stock 15,989,000,000 -11,708,000,000 10,721,000,000 -19,543,000,000 -22,968,000,000 suance offReparyments for Debt, Net 18,283,000,000 31,459,000,000 -10 201,000,000 -4,000,000,000 -5,518,000,000 Issuance ofRepayments for Short Term Debt, Net 7,196,000,000 4,983,000,000 -7.324,000,000 Repayments for Short Term Debt Proceeds from Issuance of Short Term Debi ssuance ofRepayments for Long Term Debt, Net 11,088,000,000 36,422,000,000 2.877.000,000 4,060,600.000 -5,618,000,000 Proceeds from Issuance of Long Term Debt 13.804 000,060 44 344 000,000 7.182 060,00 Repayments for Long Term Debi 2,796,000,000 -7,922,000,000 -10 080,060,000 -4,000,000,000 -5.510,000,000 sue and Financing Costs -3,417,000,000 Debt Issuance Costs -3,417,000,000 Cash Dividends and Interest Paid -11,006,000,000 -11,845,000,000 . 12 699,000,000 -13,811,000,000 -15.137,000,000 Cash Dividends Paid -11,006,000,000 -11,845,000,000 -12,699,000,000 -13,811,000,000 -15,137,000,000 Common Stock Dividends Paid -11,006,000,000 -11,845,060,060 12,699,000,000 -13,811,000,000 -15.137,000,000 Other Financing Cash Flow -369,000,000 -190,000,000 -971,00 0,000 -675,000.000 134,000,000 Excess Tax Benefit from Share-Based Compensation, Financing Activities Cash and Cash Equivalents, End of Period 6,510,000,000 7,683,000,000 11,946,000,000 11,356,000,000 13,576,000,000 Change in Cash 982,000,000 1,134,000,060 4 233 060,000 -475,000,000 2,421,000,000 Effect of Exchange Rate Changes -67,000,000 19,000,000 50,000,000 -115,000,000 201,000,000 Cash and Cash Equivalents, Beginning of Period .595,000,000 6,510,000,000 7 683,000,000 11,946,000.000 11,358,000,000 Change in Cash As Reported, Supplemental 915,000,000 1,153,000,000 4,203,000,000 -690,000,000 2,220,000,000 Stock Price 134 204
Step by Step Solution
There are 3 Steps involved in it

Get step-by-step solutions from verified subject matter experts