

Question: This lab is to create an Excel program for solving safety stock problem by calculating the mean and standard deviation from a random variable like
This lab is to create an Excel program for solving safety stock problem by calculating the mean and standard deviation from a random variable like the Example problem in page 267 or Problem 11.15 in page 282. In this lab, you have to create two tables/calculations: Table 1 and Table 2 below by using the data given in Table 3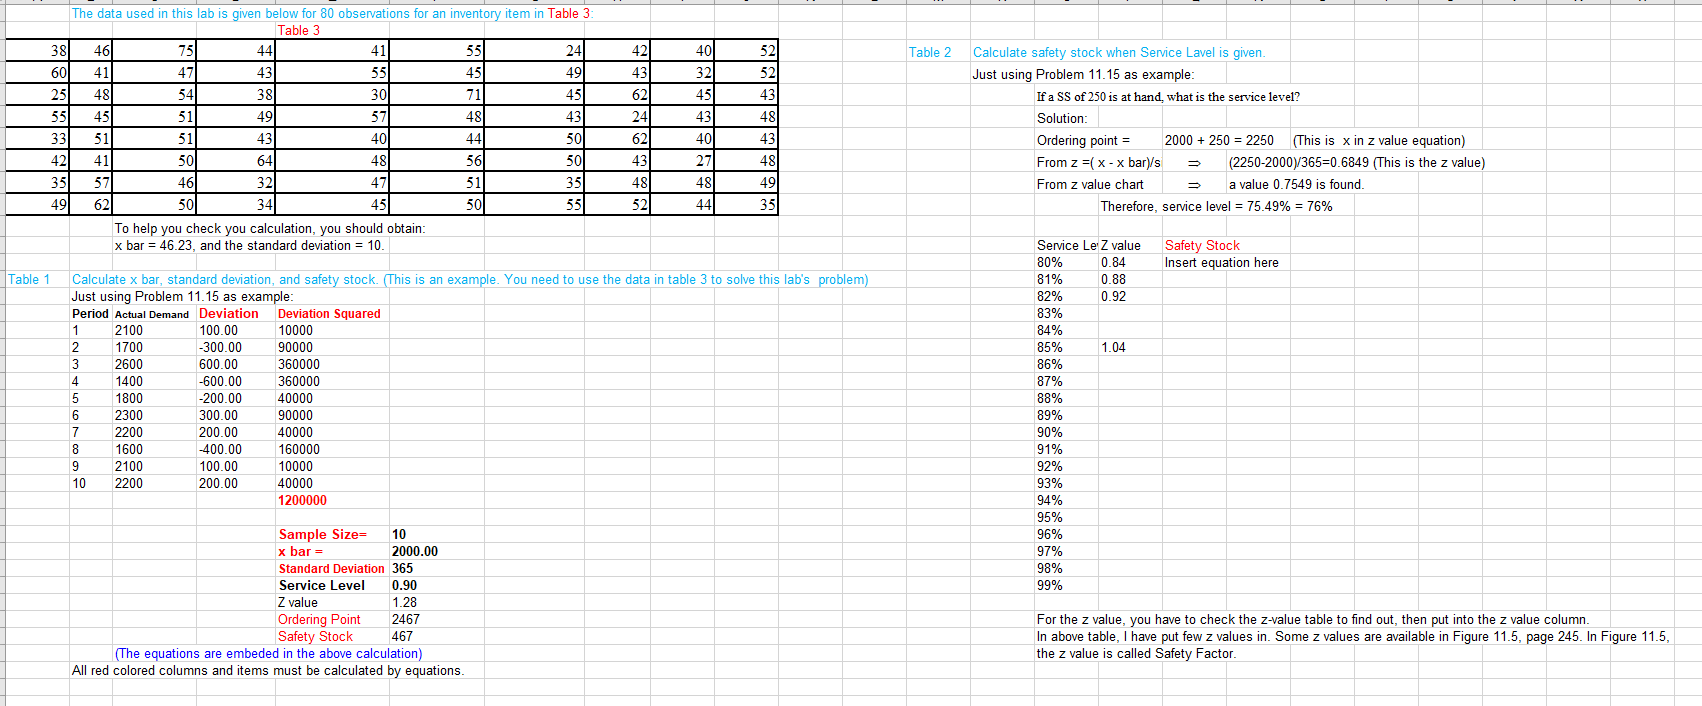
The data used in this lab is given below for 80 observations for an inventory item in Table 3 \begin{tabular}{|r|r|r|r|r|r|r|r|r|r|} \hline 38 & 46 & 75 & 44 & 41 & 55 & 24 & 42 & 40 & 52 \\ \hline 60 & 41 & 47 & 43 & 55 & 45 & 49 & 43 & 32 & 52 \\ \hline 25 & 48 & 54 & 38 & 30 & 71 & 45 & 62 & 45 & 43 \\ \hline 55 & 45 & 51 & 49 & 57 & 48 & 43 & 24 & 43 & 48 \\ \hline 33 & 51 & 51 & 43 & 40 & 44 & 50 & 62 & 40 & 43 \\ \hline 42 & 41 & 50 & 64 & 48 & 56 & 50 & 43 & 27 & 48 \\ \hline 35 & 57 & 46 & 32 & 51 & 35 & 48 & 48 & 49 \\ \hline 49 & 62 & 50 & 34 & 50 & 55 & 52 & 44 & 35 \\ \hline \end{tabular} Table 2 Calculate safety stock when Service Lavel is given. Just using Problem 11.15 as example: If a SS of 250 is at hand, what is the service level? Solution: Ordering point =2000+250=2250 (This is x in z value equation) From z=(xx bar )/s(22502000)/365=0.6849 (This is the z value) From z value chart a value 0.7549 is found Therefore, service level =75.49%=76% To help you check you calculation, you should obtain x bar =46.23, and the standard deviation =10. Table 1 Calculate x bar, standard deviation, and safety stock. (This is an example. You need to use the data in table 3 to solve this lab's problem) Just using Problem 11.15 as example: \begin{tabular}{|l|l|l|l|} \hline Period Actual Demand & Deviation & Deviation Squared \\ \hline 1 & 2100 & 100.00 & 10000 \\ \hline \end{tabular} \begin{tabular}{|l|l|l|l|} \hline 1 & 2100 & 100.00 & 10000 \\ \hline 2 & 1700 & -300.00 & 90000 \\ \hline 3 & 2600 & 600.00 & 360000 \\ \hline 4 & 1400 & -600.00 & 360000 \\ \hline 5 & 1800 & -200.00 & 40000 \\ \hline 6 & 2300 & 300.00 & 90000 \\ \hline 7 & 2200 & 200.00 & 40000 \\ \hline 8 & 1600 & -400.00 & 160000 \\ \hline 9 & 2100 & 100.00 & 10000 \\ \hline 10 & 2200 & 200.00 & 40000 \\ \hline & & & 1200000 \\ \hline \end{tabular} Sample Size = x bar =2000.00 Standard Deviation 365 Service Level Z value \begin{tabular}{|l|l|} \hline Ordering Point & 2467 \\ \hline Safety Stock & 467 \end{tabular} For the z value, you have to check the z-value table to find out, then put into the z value column. In above table, I have put few z values in. Some z values are available in Figure 11.5, page 245. In Figure 11.5, (The equations are embeded in the above calculation) the z value is called Safety Factor. All red colored columns and items must be calculated by equations
Step by Step Solution
There are 3 Steps involved in it

Get step-by-step solutions from verified subject matter experts