

Question: This must be done using MATLAB The temperature dependence of the reaction rate coefficient of a chemical reaction is often modeled by the Arrhenius equation
This must be done using MATLAB
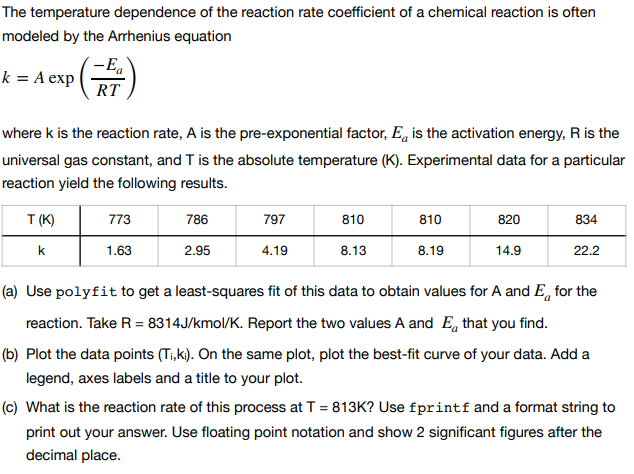
The temperature dependence of the reaction rate coefficient of a chemical reaction is often modeled by the Arrhenius equation k = A expl . RT where k is the reaction rate, A is the pre-exponential factor, Ea is the activation energy, R is the universal gas constant, and T is the absolute temperature (K). Experimental data for a particular reaction yield the following results. T (K) 773 786 797 810 810 820 834 1.63 2.95 4.19 8.13 8.19 14.9 22.2 (a) Use polyfit to get a least-squares fit of this data to obtain values for A and Eg for the reaction. Take R 8314J/kmol/K. Report the two values A and Ea that you find (b) Plot the data points (Ti,ki). On the same plot, plot the best-fit curve of your data. Add a legend, axes labels and a title to your plot. (c) What is the reaction rate of this process at T 813K? Use fprintf and a format string to print out your answer. Use floating point notation and show 2 significant figures after the decimal place
Step by Step Solution
There are 3 Steps involved in it

Get step-by-step solutions from verified subject matter experts