

Question: This needs to be done in excel so please include formulas / cell references to show your work / calculations so I can learn how
This needs to be done in excel so please include formulascell references to show your workcalculations so I can learn how to do this. Thank you so much.
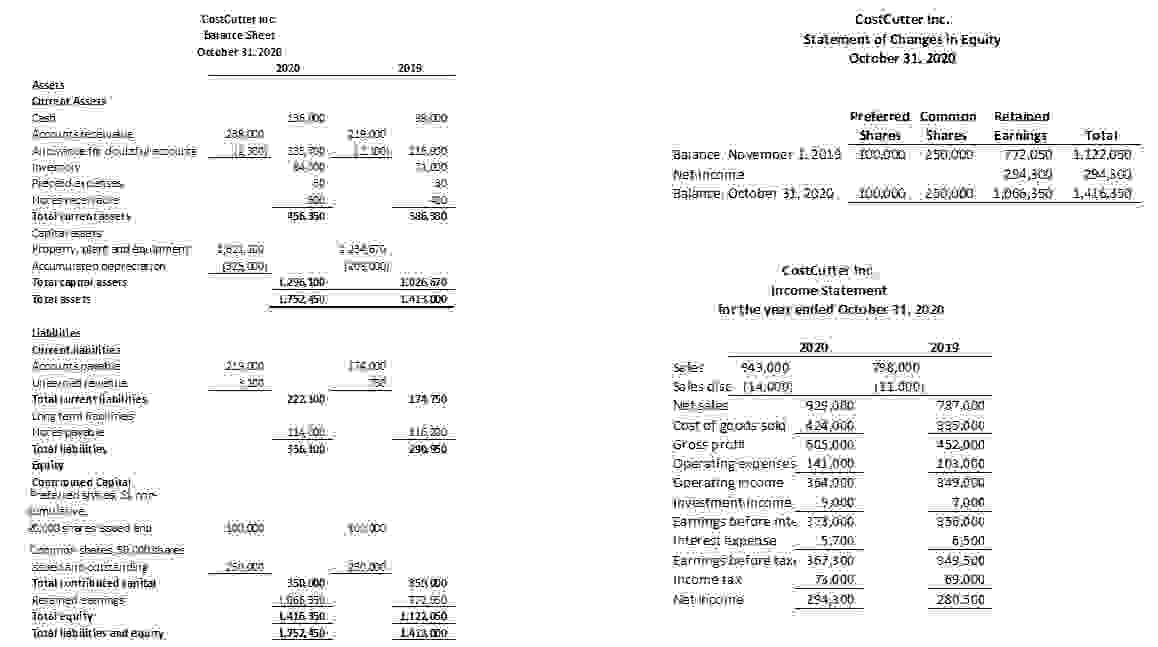
No dividends were declared or paid for the years ended October and The market value per common share on October and were $ and $ respectively.
Industry averages for are provided in the chart below.
Required:
Create the chart below in Excel and calculate all the ratios listed for
and For ratios expressed as a percentage include the percent sign
in your worksheet. Round all ratios to two decimal places. State whether
each ratio is favourable or unfavourable FU compared to the previous
year and the industry average.
Choose of your favorite ratios from the list above and explain why the
change is favorable or unfavorable.Other information
No dividends were declared or paid for the years ended October and
The market value per common share on October and were $ and $ respectively.
Industry averages for are provided in the chart below.
Create the chart below in Excel and calculate all the ratios listed for and For ratios expressed as a percentage include the percent sign in your worksheet. Round all ratios to two decimal places. State whether each ratio is favourable or unfavourable FU compared to the previous year and the industry average.
Choose of your favorite ratios from the list above and explain why the change is favorable or unfavorable.
Step by Step Solution
There are 3 Steps involved in it
1 Expert Approved Answer
Step: 1 Unlock

Question Has Been Solved by an Expert!
Get step-by-step solutions from verified subject matter experts
Step: 2 Unlock
Step: 3 Unlock