

Question: This paper demonstrates, via a short interactive case analysis, an effective method for teaching Theory of Constraints (TOC) using Excel's Solver tool. Southern Frozen
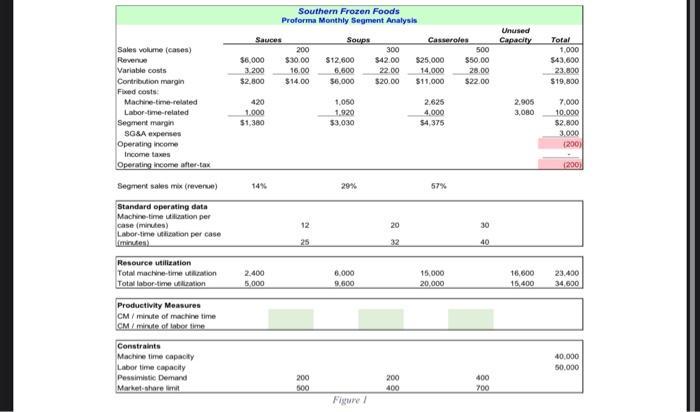
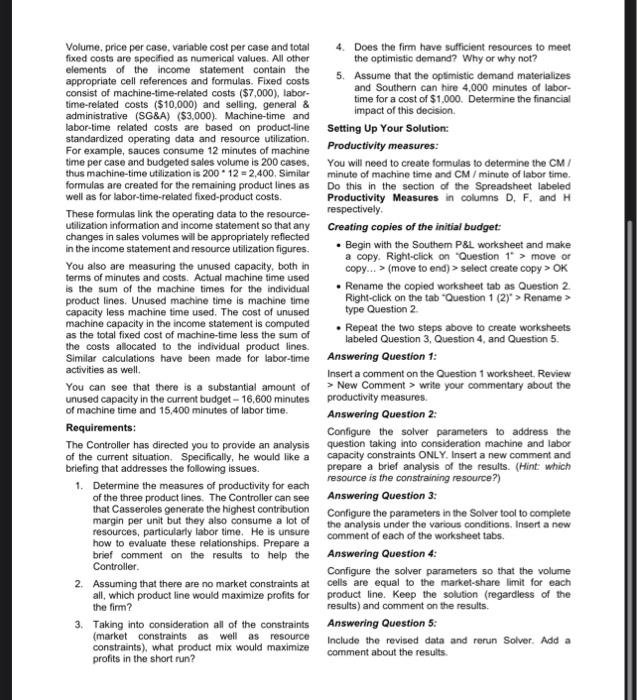
This paper demonstrates, via a short interactive case analysis, an effective method for teaching Theory of Constraints (TOC) using Excel's Solver tool. Southern Frozen Foods produces prepared frozen foods in three product lines and is concerned about how the current product mix consumes its fixed resources. Management wants to determine how to more efficiently utilize its capacity and improve profitability. What is Southern's most profitable product mix? Do they have the capacity to meet demand? What is the value of adding capacity? Excel's Solver Tool is an extremely powerful yet simple to use tool, providing the accountant with the ability to explore the relationships between product mix, profitability, and resource utilization. The basic steps in setting-up the spreadsheet are to create a contribution margin income statement, specify standard operating data, establish resource utilization, and identify the firm's constraints. The fundamental concept of Theory of Constraints (TOC), articulated by Eliyahu M. Goldratt and Jeff Cox in their 1984 book The Goal, is actually quite simple. TOC states that every organization is faced with at least one factor that limits the firm's ability to earn profits. Given this core concept, the manager who wants more profits must manage the constraint(s) faced by the enterprise. Students are asked to take the role of assisting the controller for Southern Frozen Foods in the evaluation of several internal and external constraints. Although the case is very concise, numerous analyses can be explored in a reasonable time period. The case can be used in any managerial accounting course once students have a fundamental understanding of contribution margin and cost-volume-profit analysis. SOUTHERN FROZEN FOODS, INC.: IMPROVING The Controller for Southern Frozen Foods asks you to help figure out a way to improve profits. Currently, the firm is operating at a small net operating loss and the CEO would clearly like to see some improvement. Specifically, she wants to know the most profitable product mix, whether the company has the capacity to meet expected demand, and the value of adding capacity. Using paper and a pencil to complete the analysis would take hours. Using Excel's Solver can save huge amounts of time and produce better reports to management. The company produces three frozen-food product lines: sauces and soups are produced in five-pound boil-in- bag packages and casseroles in four-pound aluminum pans. The product lines vary significantly in their consumption of machine and labor time. So far, you have prepared a basic spreadsheet (see the Figure 1 below). The spreadsheet includes monthly budgeted RESOURCE UTILIZATION AND PROFITABILITY sales volume, revenues, variable cost and contribution margin by product line. The company faces several constraints within which it must operate. In this case it is limited to 40,000 minutes of machine time and 50,000 minutes of labor time each. period. Additionally, the company serves a limited market: It cannot expect to sell more than 500 cases of sauces, 400 cases of soup and 700 cases casseroles. Minimum expected demand (pessimistic demand) is also noted in the analysis. The budgeted income statement shows Southern generating a loss of $200 for the month, with a product mix of 200 cases of sauces, 300 soups and 500 casseroles. Standard contribution margin analysis suggests that casseroles, at $22 contribution margin per case, are the most profitable product. Sauces generate $14 per case and soups $20. Sales volume (cases) Revenue Variable costs Contribution margin Fixed costs: Machine-time-related Labor-time-related Segment margin SG&A expenses Operating income Income taxes Operating income after-tax Segment sales mix (revenue) Standard operating data Machine-time utilization per case (minutes) Labor-time utilization per case (minutes) Resource utilization Total machine-time utiization Total labor-time utilization Productivity Measures CM/ minute of machine time CM/ minute of tabor time Constraints Machine time capacity Labor time capacity Pessimistic Demand Market-share limit Sauces $6,000 3,200 $2,800 420 1.000 $1,380 14% Southern Frozen Foods Proforma Monthly Segment Analysis Soups 2,400 5,000 200 300 $30.00 $12,600 $42.00 $25,000 16.00 6,600 22.00 $14.00 $6,000 $20.00 12 25 200 500 1,050 1.920 $3,030 29% 6,000 9.600 Figure 1 20 32 Casseroles 200 400 14,000 $11,000 2.625 4.000 $4,375 57% 15,000 20,000 500 $50.00 28.00 $22.00 30 40 400 700 Unused Capacity 2.905 3,080 16,600 15,400 Total 1,000 $43,600 23.800 $19,800 7,000 10.000 $2,800 3,000 (200) (200) 23.400 34,600 40,000 50,000 Volume, price per case, variable cost per case and total fixed costs are specified as numerical values. All other elements of the income statement contain the appropriate cell references and formulas. Fixed costs consist of machine-time-related costs ($7,000), labor- time-related costs ($10,000) and selling, general & administrative (SG&A) ($3,000). Machine-time and labor-time related costs are based on product-line standardized operating data and resource utilization. For example, sauces consume 12 minutes of machine time per case and budgeted sales volume is 200 cases. thus machine-time utilization is 200 12=2,400. Similar formulas are created for the remaining product lines as well as for labor-time-related fixed-product costs. These formulas link the operating data to the resource- utilization information and income statement so that any changes in sales volumes will be appropriately reflected in the income statement and resource utilization figures. You also are measuring the unused capacity, both in terms of minutes and costs. Actual machine time used is the sum of the machine times for the individual product lines. Unused machine time is machine time capacity less machine time used. The cost of unused machine capacity in the income statement is computed as the total fixed cost of machine-time less the sum of the costs allocated to the individual product lines. Similar calculations have been made for labor-time activities as well. You can see that there is a substantial amount of unused capacity in the current budget-16,600 minutes of machine time and 15,400 minutes of labor time. Requirements: The Controller has directed you to provide an analysis of the current situation. Specifically, he would like a briefing that addresses the following issues. 1. Determine the measures of productivity for each of the three product lines. The Controller can see that Casseroles generate the highest contribution margin per unit but they also consume a lot of resources, particularly labor time. He is unsure how to evaluate these relationships. Prepare a brief comment on the results to help the Controller. 2. Assuming that there are no market constraints at all, which product line would maximize profits for the firm? 3. Taking into consideration all of the constraints (market constraints as well as resource constraints), what product mix would maximize profits in the short run? 4. Does the firm have sufficient resources to meet the optimistic demand? Why or why not? 5. Assume that the optimistic demand materializes and Southern can hire 4,000 minutes of labor- time for a cost of $1,000. Determine the financial impact of this decision. Setting Up Your Solution: Productivity measures: You will need to create formulas to determine the CM/ minute of machine time and CM / minute of labor time. Do this in the section of the Spreadsheet labeled Productivity Measures in columns D. F. and H respectively. Creating copies of the initial budget: Begin with the Southern P&L worksheet and make a copy. Right-click on "Question 1 > move or copy...> (move to end)> select create copy > OK Rename the copied worksheet tab as Question 2. Right-click on the tab "Question 1 (2) > Rename > type Question 2. Repeat the two steps above to create worksheets labeled Question 3, Question 4, and Question 5. Answering Question 1: Insert a comment on the Question 1 worksheet. Review > New Comment > write your commentary about the productivity measures. Answering Question 2: Configure the solver parameters to address the question taking into consideration machine and labor capacity constraints ONLY. Insert a new comment and prepare a brief analysis of the results. (Hint: which resource is the constraining resource?) Answering Question 3: Configure the parameters in the Solver tool to complete the analysis under the various conditions. Insert a new comment of each of the worksheet tabs. Answering Question 4: Configure the solver parameters so that the volume cells are equal to the market-share limit for each product line. Keep the solution (regardless of the results) and comment on the results. Answering Question 5: Include the revised data and rerun Solver. Add a comment about the results.
Step by Step Solution
3.38 Rating (160 Votes )
There are 3 Steps involved in it
The paper demonstrates an effective method for teaching the Theory of Constraints TOC using Excels S... View full answer

Get step-by-step solutions from verified subject matter experts