

Question: This pie chart is from a report produced by the California Community Colleges, Chancellor's Office, representing student's enrollment in Fall 2015. a) What is the
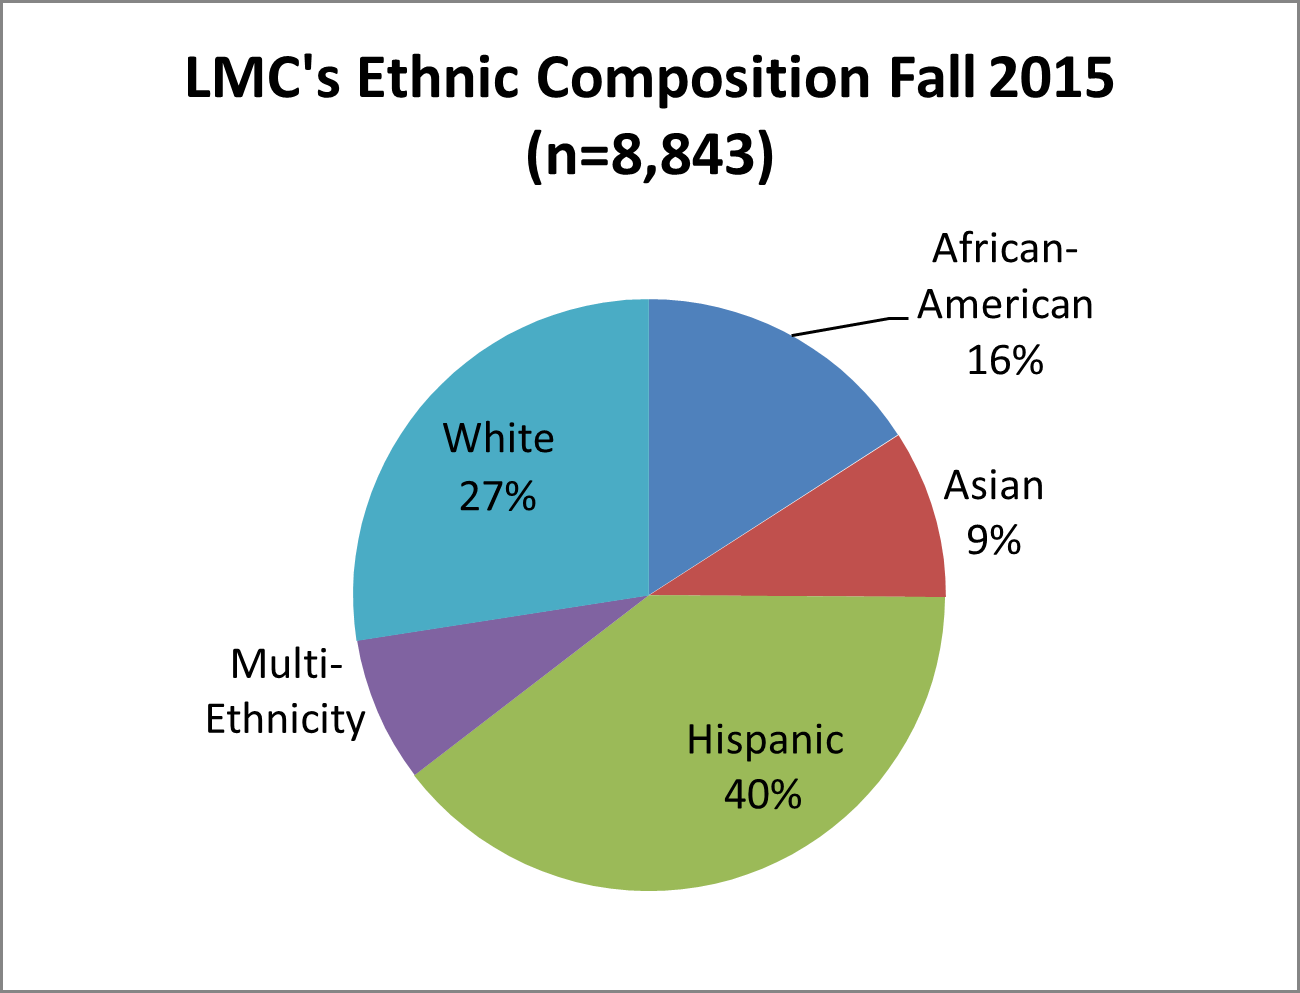
This pie chart is from a report produced by the California Community Colleges, Chancellor's Office, representing student's enrollment in Fall 2015.
a) What is the variable that is being measured?
Step by Step Solution
There are 3 Steps involved in it
1 Expert Approved Answer
Step: 1 Unlock

Question Has Been Solved by an Expert!
Get step-by-step solutions from verified subject matter experts
Step: 2 Unlock
Step: 3 Unlock