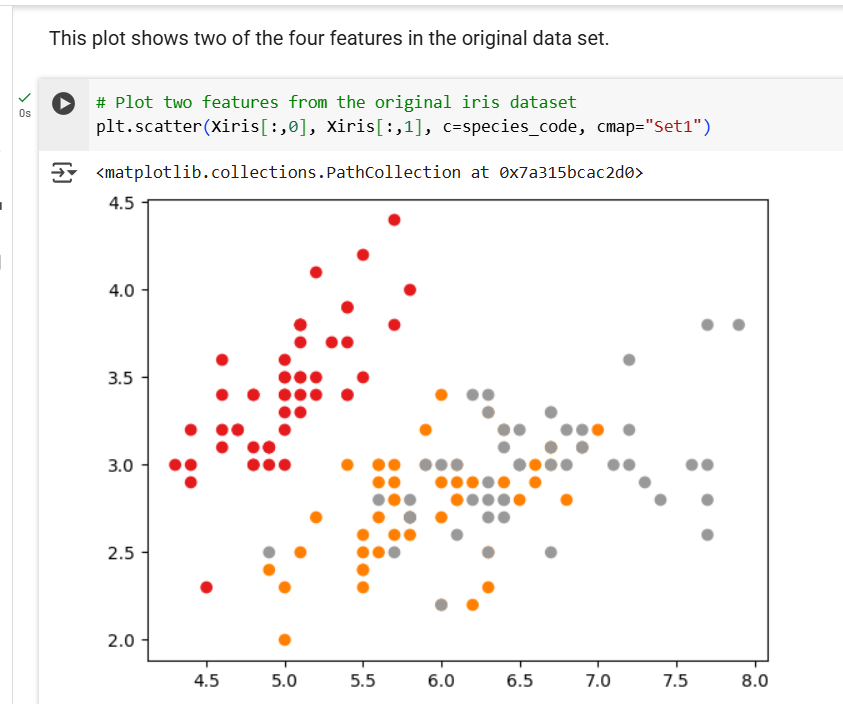
Question: This plot shows two of the four features in the original data set. C # Plot two features from the original iris dataset plt. scatter(Xiris[

This plot shows two of the four features in theThis plot shows two of the four features in the
This plot shows two of the four features in the original data set. C # Plot two features from the original iris dataset plt. scatter(Xiris[ :,0], xiris[ :,1], c=species_code, cmap="set1") 4.5 4.0 . 3.5 3.0 2.5 2.0 4.5 5.0 5.5 6.0 6.5 7.0 7.5 8.0[ ] # Plot the PCA1 and PCA2 from the iris dataset plt . scatter(XirisPCA2[ : , 0], XirisPCA2[ : , 1], c=species_code, cmap="Set1") 1.5 1.0 0.5 0.0 -0.5 -1.0 -3 -2 -1 0 1 2 3 4

Step by Step Solution

There are 3 Steps involved in it

1 Expert Approved Answer
Step: 1 Unlock blur-text-image
Question Has Been Solved by an Expert!

Get step-by-step solutions from verified subject matter experts

Step: 2 Unlock
Step: 3 Unlock

Students Have Also Explored These Related Accounting Questions!