

Question: This project is designed to help you understand how to use Venn Diagrams to organize data and answer questions. We encourage you to go
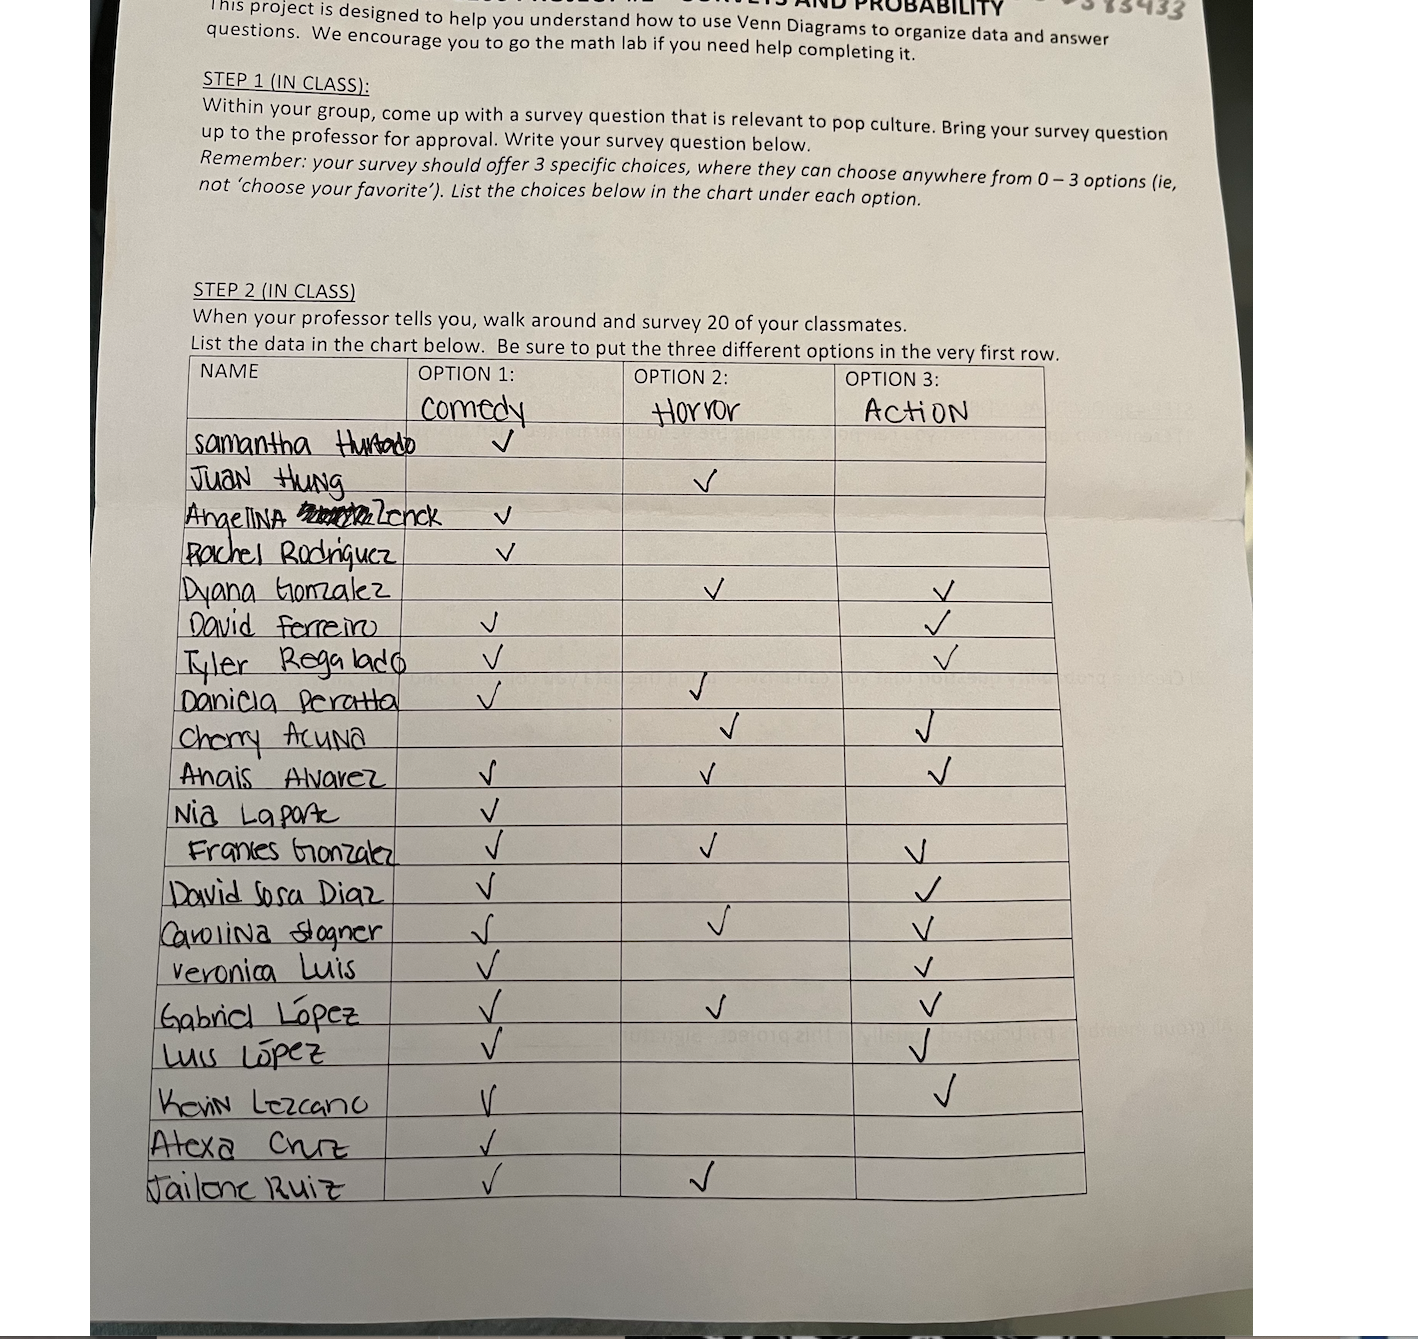
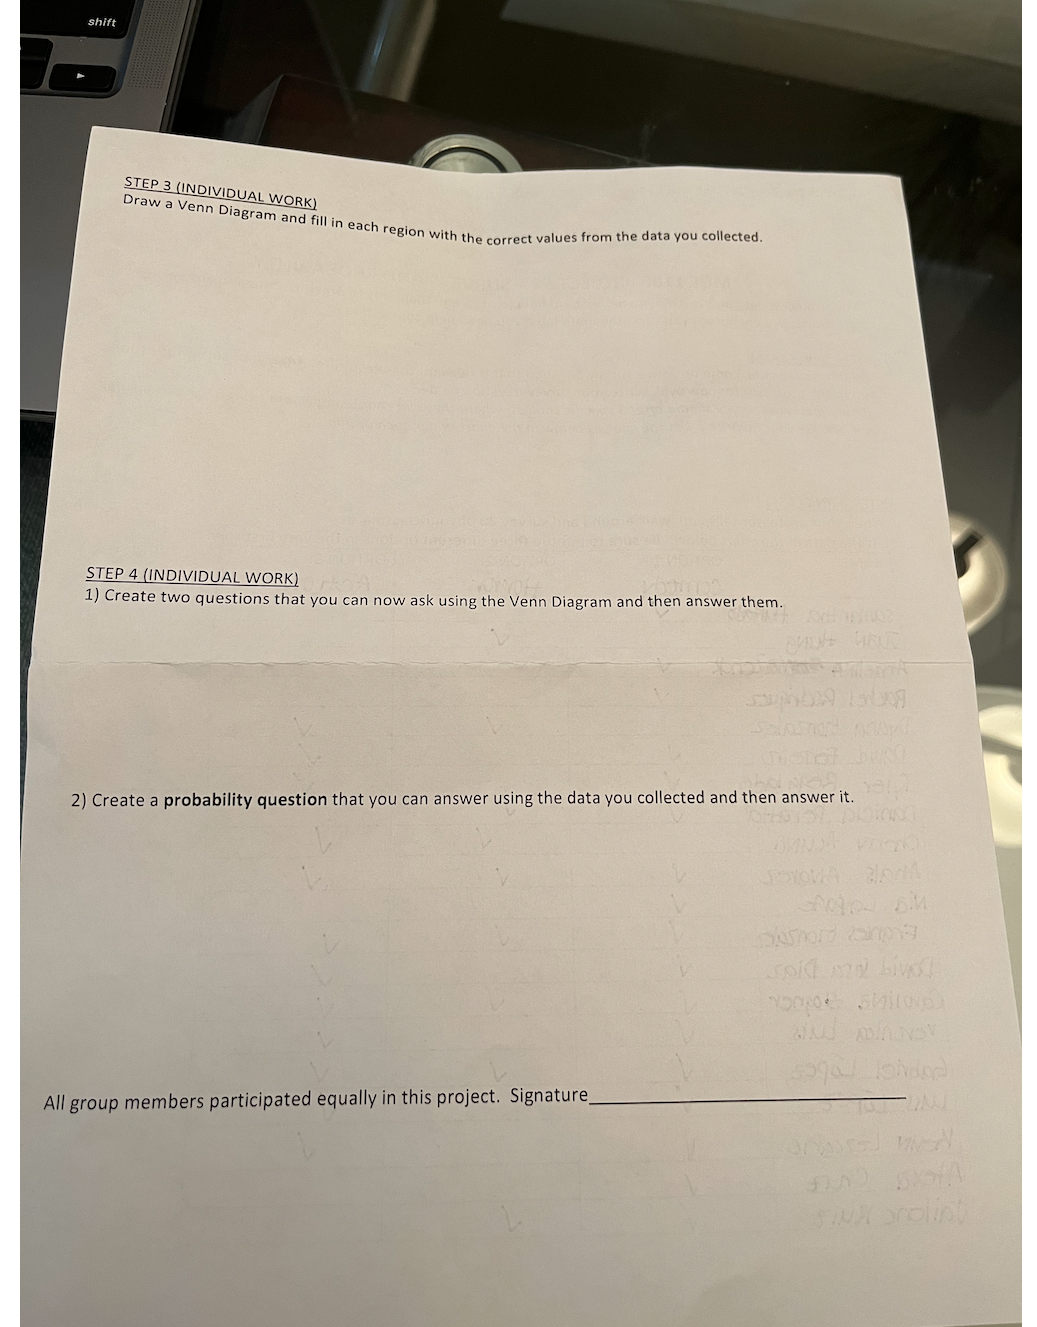
This project is designed to help you understand how to use Venn Diagrams to organize data and answer questions. We encourage you to go the math lab if you need help completing it. STEP 1 (IN CLASS): Within your group, come up with a survey question that is relevant to pop culture. Bring your survey question up to the professor for approval. Write your survey question below. Remember: your survey should offer 3 specific choices, where they can choose anywhere from 0-3 options (ie, not 'choose your favorite'). List the choices below in the chart under each option. STEP 2 (IN CLASS) When your professor tells you, walk around and survey 20 of your classmates. List the data in the chart below. Be sure to put the three different options in the very first row. NAME OPTION 1: OPTION 2: OPTION 3: Samantha Hurtado Comedy Juan Hung AngeliNALenck Rachel Rodriguez Dyana Gonzalez David Ferreir Tyler Regalado Daniela peratta Cherry AcuNa Anais Alvarez Nia La porte Frances Gonzalez David Sora Diaz Carolina Sogner Veronica Luis Gabriel Lopez Luis Lopez Kevin Lezcano Jailene Ruiz V V V Horror J Action V V V 433 shift STEP 3 (INDIVIDUAL WORK) Draw a Venn Diagram and fill in each region with the correct values from the data you collected. STEP 4 (INDIVIDUAL WORK) 1) Create two questions that you can now ask using the Venn Diagram and then answer them. DA? All group members participated equally in this project. Signature_ Sub9 1b08 2) Create a probability question that you can answer using the data you collected and then answer it. bung FOTOWA 20A Dasmord na sold 029 Livd You Shilol and innov $990/ Johand SINA srolint
Step by Step Solution
There are 3 Steps involved in it

Get step-by-step solutions from verified subject matter experts