

Question: This question: 1 point(s) possible Submit test Find the area of the shaded region. The graph to the right depicts IQ scores of adults, and
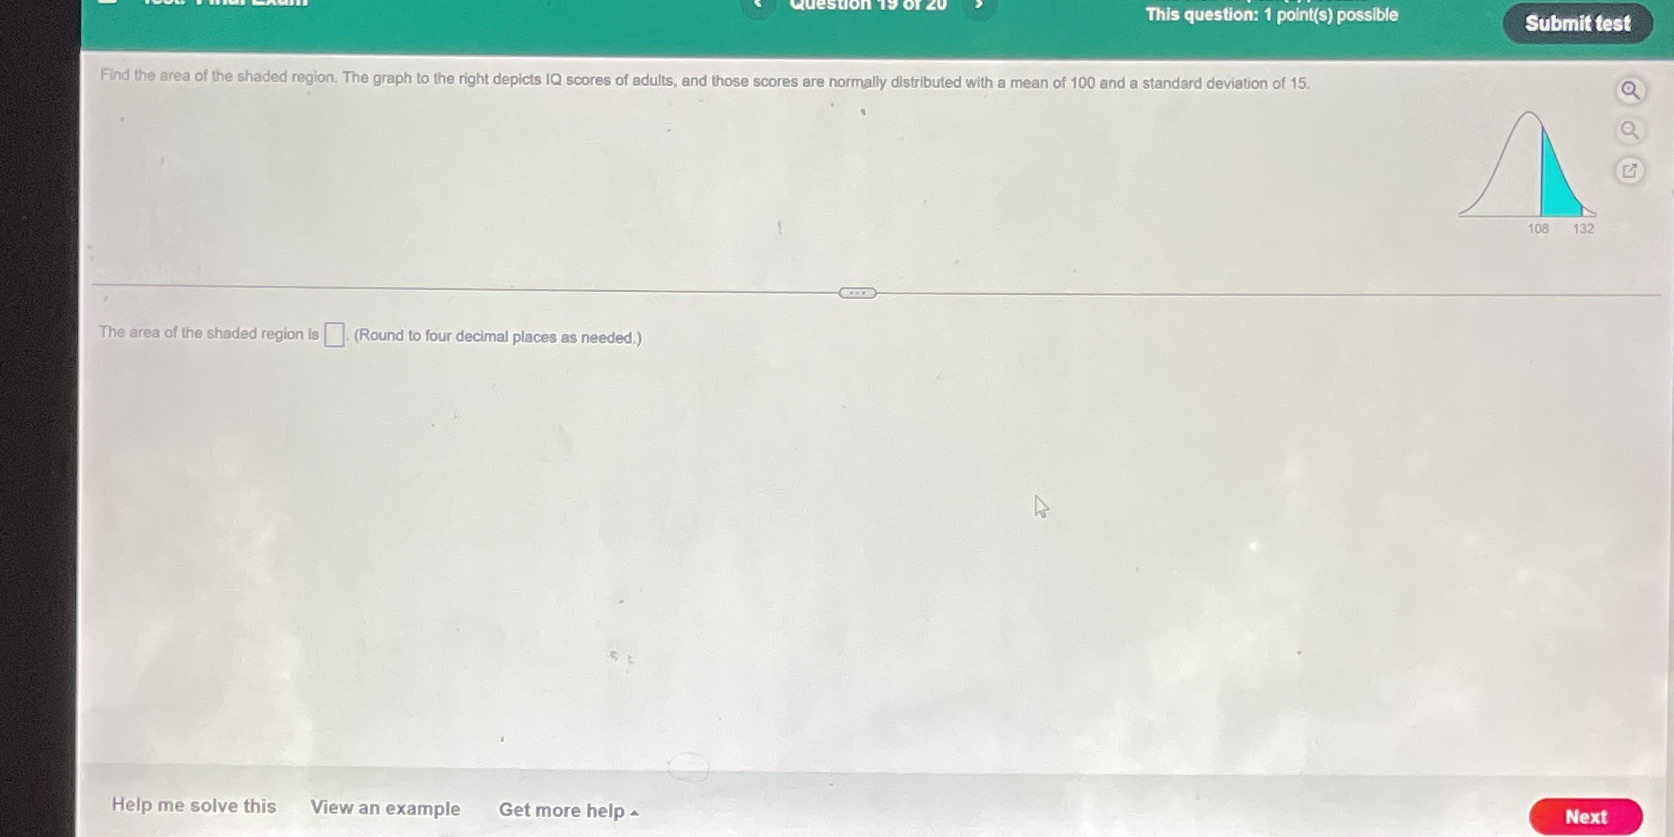
This question: 1 point(s) possible Submit test Find the area of the shaded region. The graph to the right depicts IQ scores of adults, and those scores are normally distributed with a mean of 100 and a standard deviation of 15. 108 132 The area of the shaded region is . (Round to four decimal places as needed.) Help me solve this View an example Get more help - Next
Step by Step Solution
There are 3 Steps involved in it
1 Expert Approved Answer
Step: 1 Unlock

Question Has Been Solved by an Expert!
Get step-by-step solutions from verified subject matter experts
Step: 2 Unlock
Step: 3 Unlock