

Question: This question: 7 point(s) possible Submit test A sociologist was interested in whether men in Halifax spent more on flowers for Valentine's Day than men
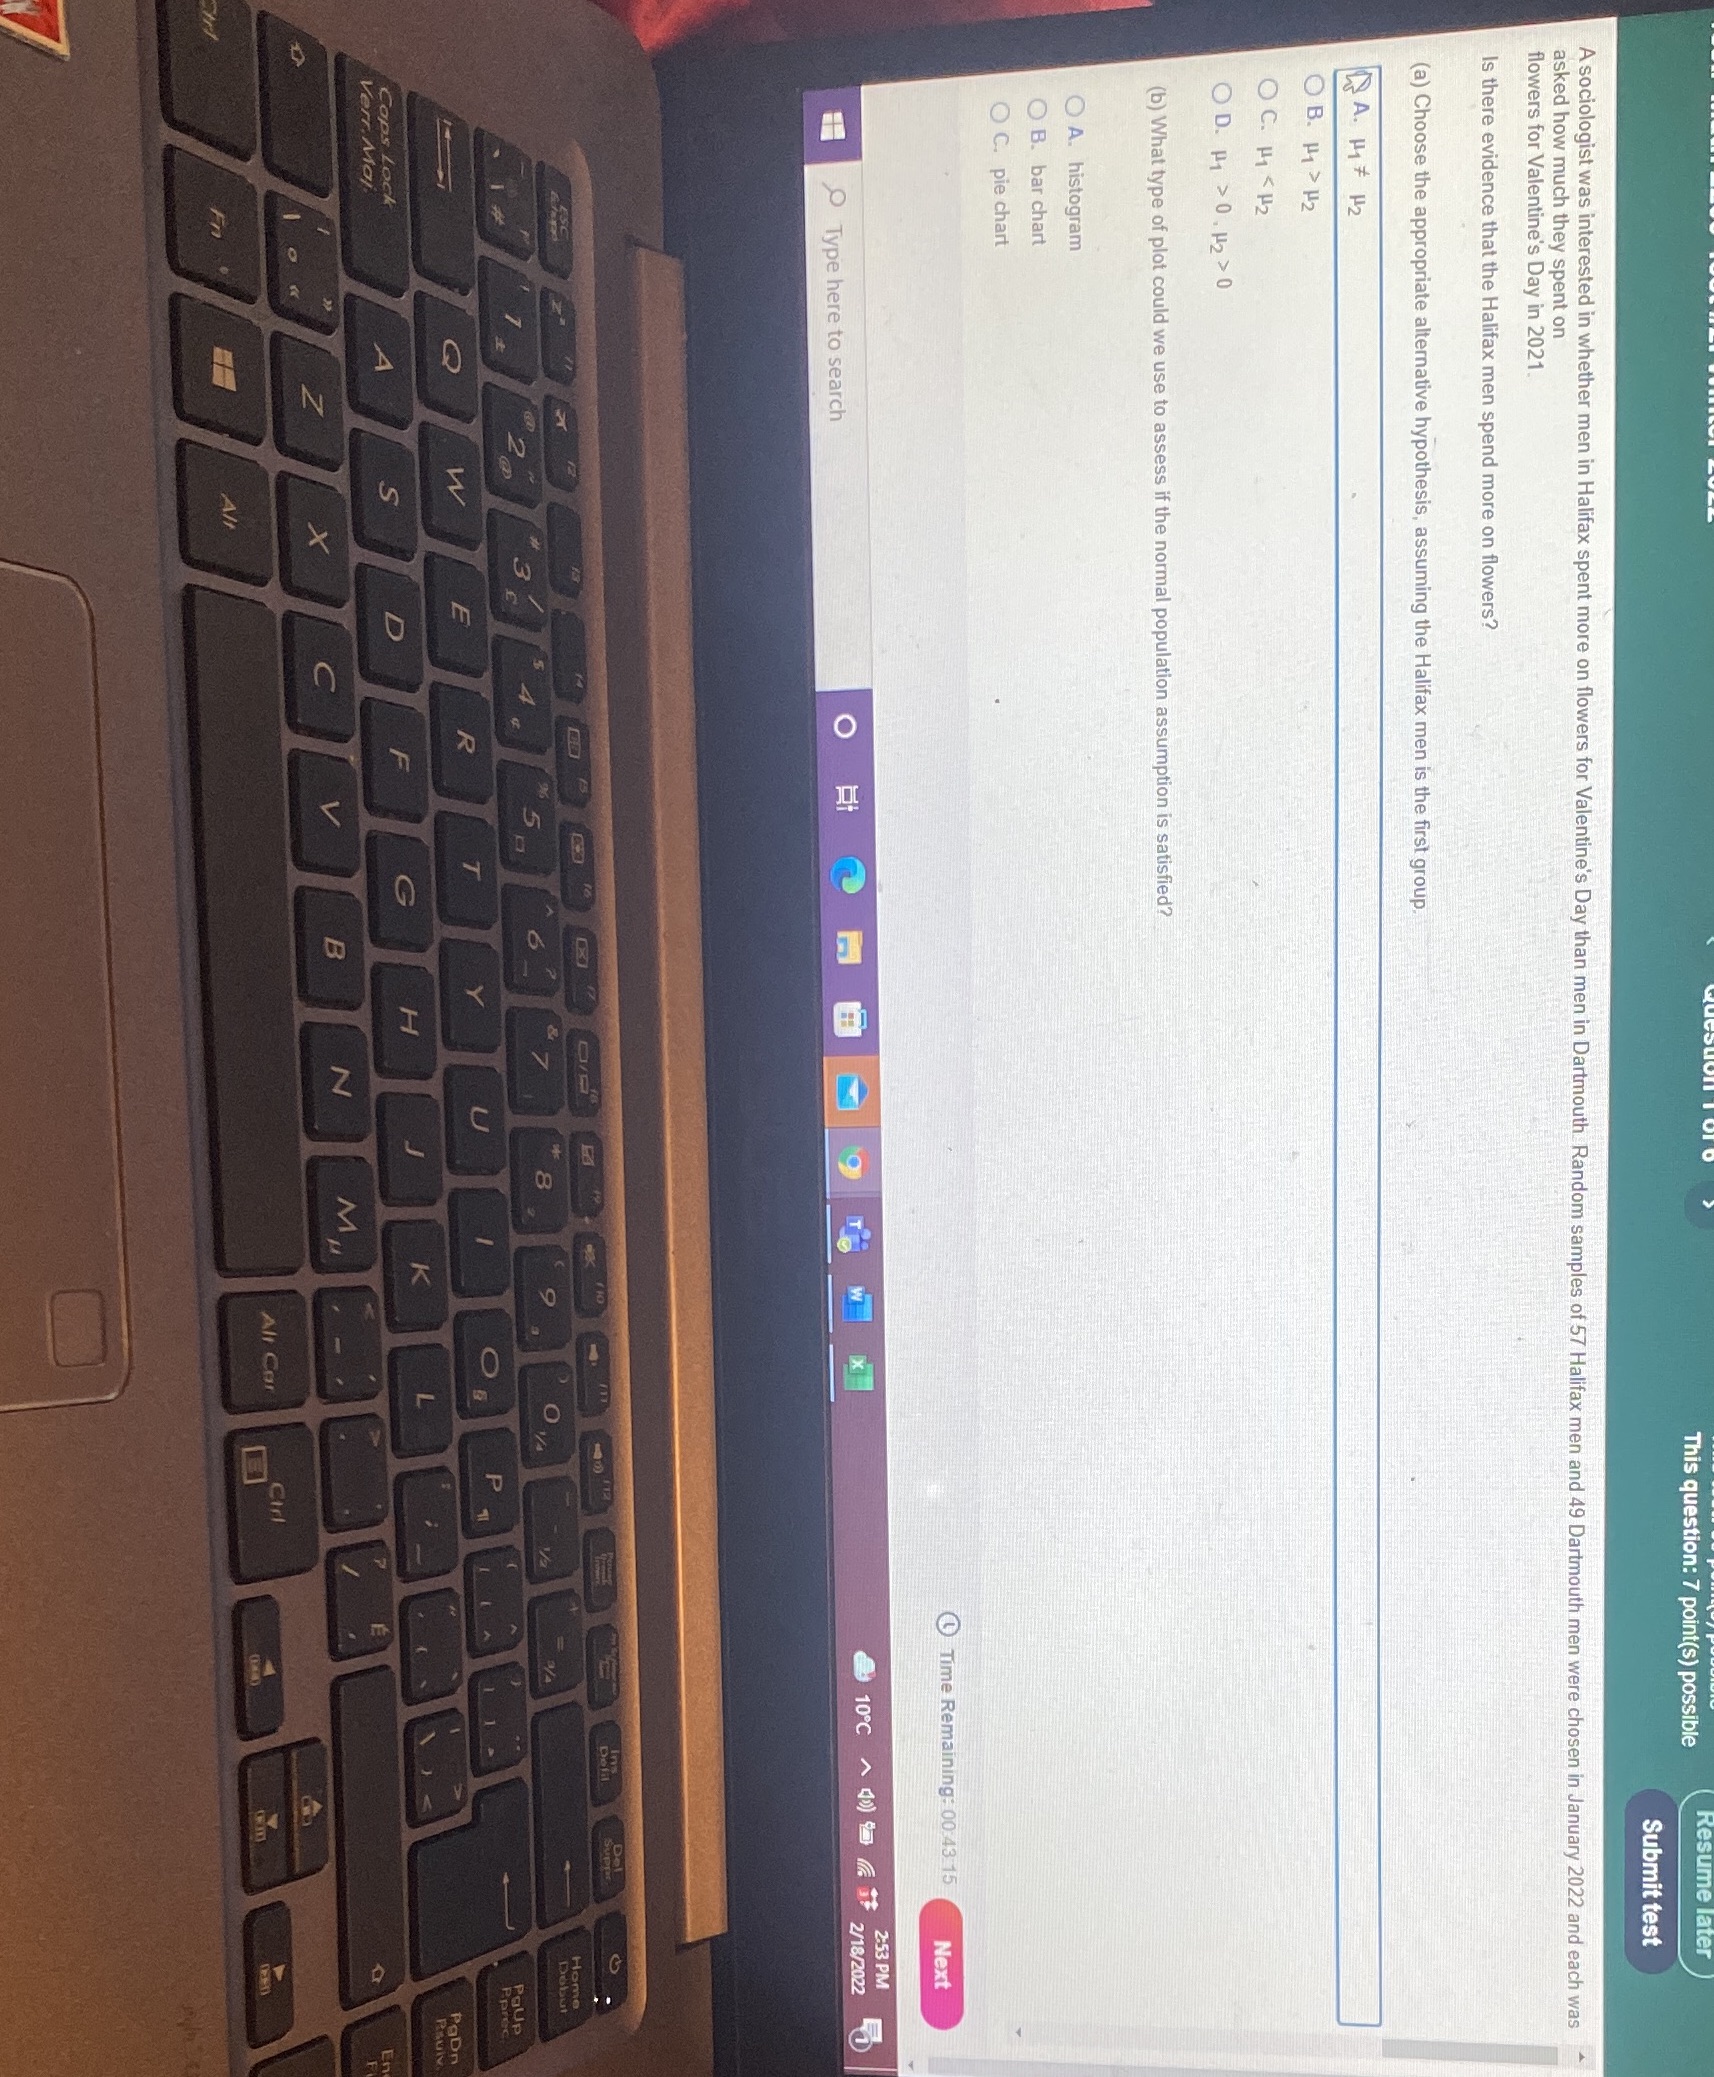

This question: 7 point(s) possible Submit test A sociologist was interested in whether men in Halifax spent more on flowers for Valentine's Day than men in Dartmouth_ Random samples of 57 Halifax men and 49 Dartmouth men were chosen in January 2022 and each was asked how much they spent on flowers for Valentine's Day in 2021. Is there evidence that the Halifax men spend more on flowers? (a) Choose the appropriate alternative hypothesis, assuming the Halifax men is the first group. A . My * H2 OB. H1 > H2 OC. H1
0. H2>0 (b) What type of plot could we use to assess if the normal population assumption is satisfied? O A. histogram O B. bar chart O C. pie chart Time Remaining: 00:43 15 Next 2:53 PM W X 10 C ~ 4) 43, 2/18/2022 Type here to search O Home 7 8 P/A 3 4 5 2 2 PoUp O P 1 W PRUN V Caps Lock En Verr, Mal X All Car
Step by Step Solution
There are 3 Steps involved in it
1 Expert Approved Answer
Step: 1 Unlock

Question Has Been Solved by an Expert!
Get step-by-step solutions from verified subject matter experts
Step: 2 Unlock
Step: 3 Unlock