

Question: This question covers the Support Vector Machine and requires you to refer to the following two-dimensional training data: arg max x1 -3 (a) [1
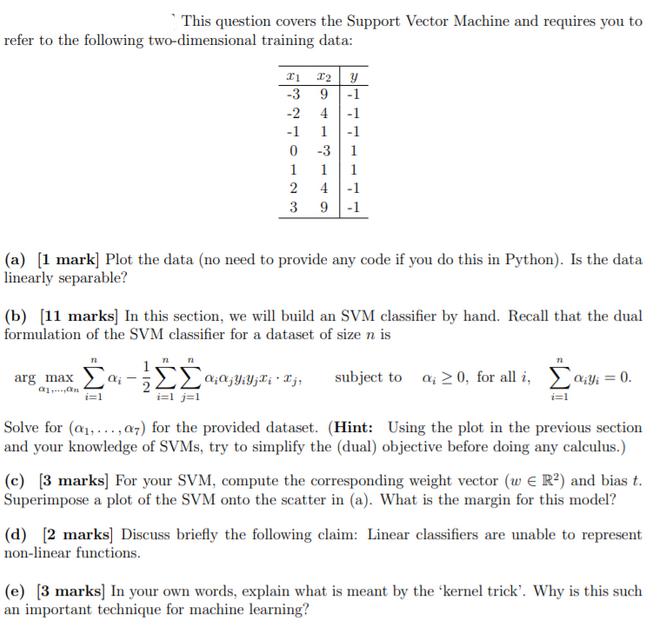
This question covers the Support Vector Machine and requires you to refer to the following two-dimensional training data: arg max x1 -3 (a) [1 mark] Plot the data (no need to provide any code if you do this in Python). Is the data linearly separable? n i=1 -2 -1 0 1 2 3 (b) [11 marks] In this section, we will build an SVM classifier by hand. Recall that the dual formulation of the SVM classifier for a dataset of size n is n - 04-19 i=1 j=1 I2 Y 9 -1 4 -1 1 -1 -3 1 1 1 4 -1 9 -1 subject to a, 20, for all i, ai = 0. Solve for (a,...,07) for the provided dataset. (Hint: Using the plot in the previous section and your knowledge of SVMs, try to simplify the (dual) objective before doing any calculus.) (c) [3 marks] For your SVM, compute the corresponding weight vector (w R) and bias t. Superimpose a plot of the SVM onto the scatter in (a). What is the margin for this model? (d) [2 marks] Discuss briefly the following claim: Linear classifiers are unable to represent non-linear functions. (e) [3 marks] In your own words, explain what is meant by the 'kernel trick'. Why is this such an important technique for machine learning?
Step by Step Solution
There are 3 Steps involved in it
a To plot the data in Python you can use libraries such as Matplotlib or Seaborn Here is an example ... View full answer

Get step-by-step solutions from verified subject matter experts