

Question: This question has two parts. First, answer Part A. Then, answer Part B. Use the graph to answer both parts. CO 2 00 2 3
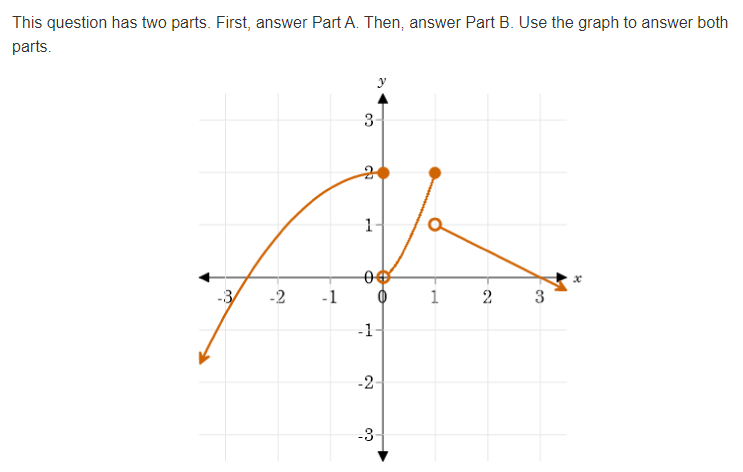
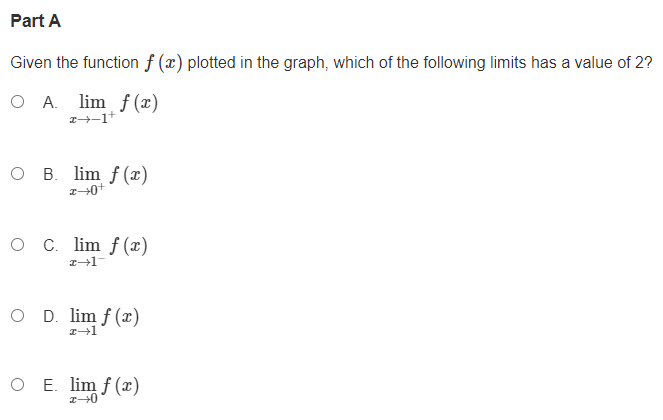


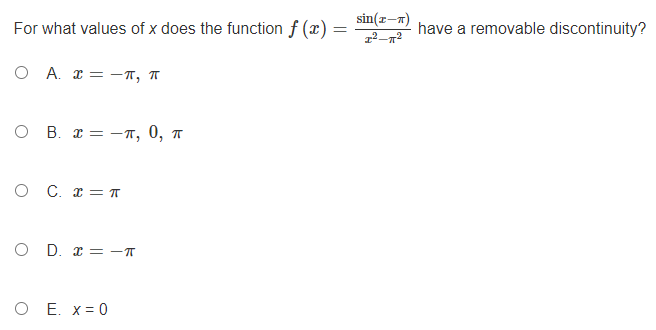


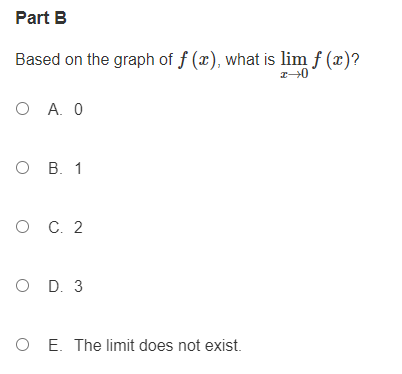


This question has two parts. First, answer Part A. Then, answer Part B. Use the graph to answer both parts. CO 2 00 2 3 -3 -2 -1 -1 -2 -3Part A Given the function f (@ ) plotted in the graph, which of the following limits has a value of 2? O A. lim f (x) O B. lim f (x) I-+0 O C. lim f (x) O D. lim f (x) O E. lim f (x)Part B Based on the graph of f (x), what is lim f (x)? O A. 0 O B. 1 O C. 2 O D. 3 O E. The limit does not exist.\fsin(I-7) For what values of x does the function f (x) = have a removable discontinuity? 12-12 O A T = -1, T O B. T = -T, 0, T OCT=T O DT= -T O E. X= 0FartA 1+1; mat not differentiable at x = '1\"? Why is the function fps) = 1:2 i a: i 2, 1c 3 1 O A. The graph of the function has a cusp at X = 'i. O B. The graph of the function has a corner at X = 1. O C. The graph of the function has a hole at x = 1. O D. The graph of the function has a vertical asymptote at :c : 1. O E. The function is undefined atx = i. Part B 1 + - a-I ' a
Step by Step Solution
There are 3 Steps involved in it

Get step-by-step solutions from verified subject matter experts