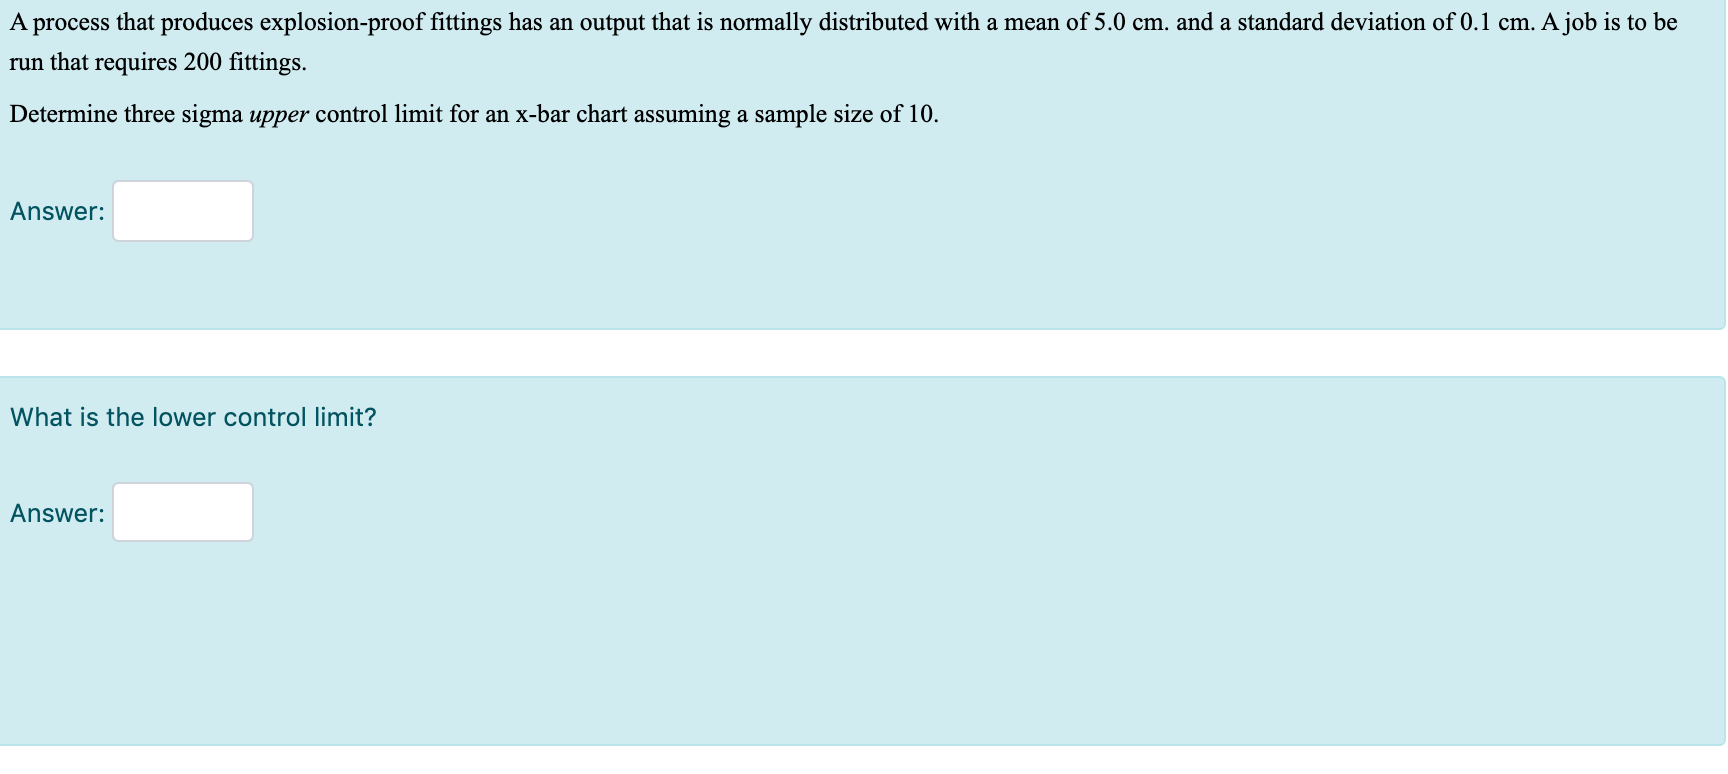
Question: This question is all together so cannot be posted separately as you need all 3 parts for each question! A process that produces explosion-proof fittings

This question is all together so cannot be postedThis question is all together so cannot be postedThis question is all together so cannot be posted separately as you need all 3 parts for each question!

A process that produces explosion-proof fittings has an output that is normally distributed with a mean of 5.0 cm. and a standard deviation of 0.1 cm. A job is to be run that requires 200 fittings. Determine three sigma upper control limit for an x-bar chart assuming a sample size of 10. Answer: What is the lower control limit? Answer: The following is an x-bar SPC chart for this process. Based on this SPC chart, is this process in control? If not, why not? UCL an LCL Sample Select one: O a. Yes, the process is in control. All readings are between UCL and LCL b. No, there appears to be assignable causes of variation as shown by a trend within the readings O O C. No, there appears to be assignable causes of variation as shown by cycles within the readings O d. No, there appears to be assignable causes of variation as shown by a level shift within the readings O e. No, there appears to be assignable causes of variation as shown by too much dispersion within the readings O f. No, there appears to be assignable causes of variation as shown by a bias within the readings

Step by Step Solution

There are 3 Steps involved in it

1 Expert Approved Answer
Step: 1 Unlock blur-text-image
Question Has Been Solved by an Expert!

Get step-by-step solutions from verified subject matter experts

Step: 2 Unlock
Step: 3 Unlock

Students Have Also Explored These Related General Management Questions!