

Question: This question is from the book regression analysis by example question 5.7 and table is attached in the second picture howiu F'erfom 2-: All HadiWehsite
This question is from the book regression analysis by example
question 5.7 and table is attached in the
second picture
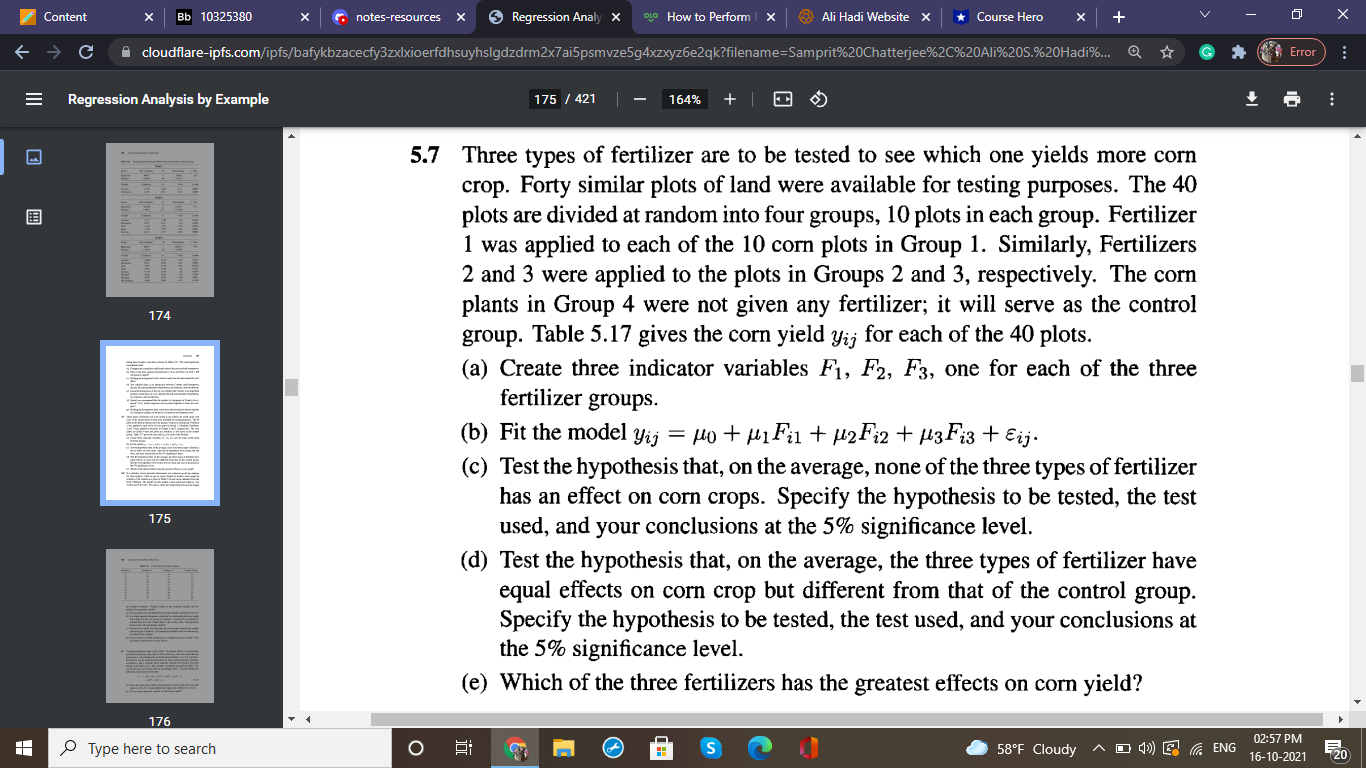
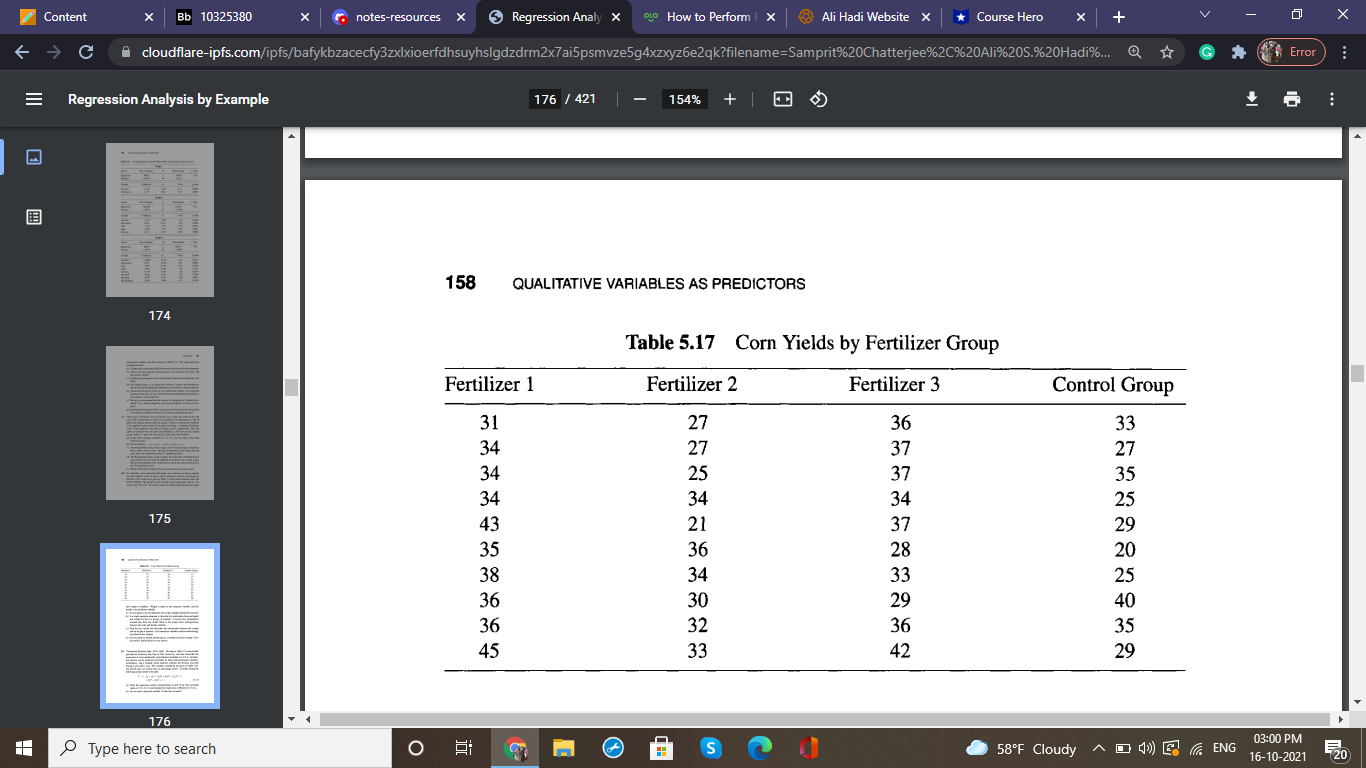
howiu F'erfom 2-: All HadiWehsite :-j w Course Hen) cloudflare-lpfs.c-.:-rn Regression Analysis by Example 5.7 Three types of fertilizer are to be tested to see which one yields more corn crop. Forty similar plots of land were available for testing purposes. The 40 plots are divided at random into four groups. 10 plots in each group. Fertilizer 1 was applied to each of the 10 com plots in Group 1. Similarly, Fertilizers 2 and 3 were applied to the plots in Groups 2 and 3, respectively. The corn plants in Group 4 were not given any fertilizer; it will serve as the control group. Table 5.17 gives the corn yield yij for each of the 40 plots. (at) Create three indicator variables F1, F2, F3, one for each of the three I fertilizer groups. (b) Fit the model is: = #0 + #11511 + #2Fiz + [131% + 533'- (c) Test the hypothesis that, on the average, none of the three types of fertilizer has an effect on corn crops. Specify the hypothesis to be tested, the test used, and your conclusions at the 5% signicance level. (d) Test the hypothesis that, on the average, the three types of fertilizer have equal effects on corn crop but different from that of the control group. Specify the hypothesis to be tested, the test used, and your conclusions at the 5% signicance level. (e) Which of the three fertilizers has the greatest effects on corn yield? O seer Cloudy --- Content X Bb 10325380 X notes-resources x 5 Regression Analy X olo How to Perform | X Ali Hadi Website X *Course Hero X + X C cloudflare-ipfs.com/ipfs/bafykbzacecfy3zxlxioerfdhsuyhslgdzdrms7ai5psmvze5g4xzxyz6e2qk?filename=Samprit%20Chatterjee%20%20Ali%205.%20Hadi%. G Error Regression Analysis by Example 176 / 421 - 154% + 158 QUALITATIVE VARIABLES AS PREDICTORS 174 Table 5.17 Corn Yields by Fertilizer Group Fertilizer 1 Fertilizer 2 Fertilizer 3 Control Group 31 27 36 33 34 27 37 27 34 25 37 35 34 34 34 25 175 43 21 37 29 35 36 28 20 38 34 33 25 36 30 29 40 36 32 36 35 45 33 42 29 176 Type here to search 03:00 PM O 58'F Cloudy ~ D () ENG 16-10-2021 -20
Step by Step Solution
There are 3 Steps involved in it

Get step-by-step solutions from verified subject matter experts