

Question: This question makes use of a data set collected in 1 8 9 8 of measurements on 1 3 6 sparrows that were found freezing
This question makes use of a data set collected in of measurements on sparrows that were found freezing and brought to a laboratory at Brown University. Of the sparrows, survived and died.
The data set sparrows.csv contains the following variables:
X sex if male, if female
X survive if sparrow survived, if it died
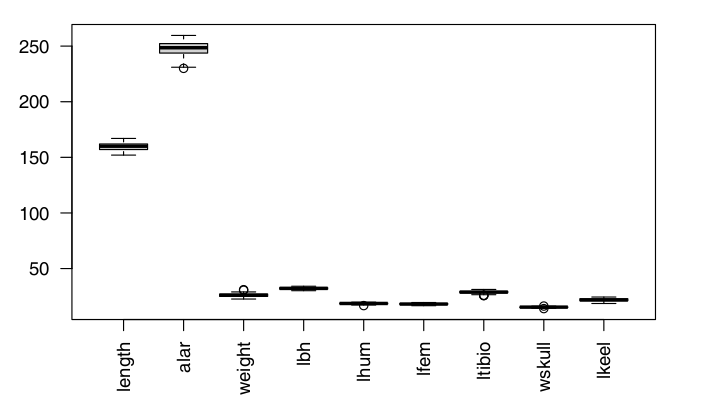
X length Total length mm
X alar Alar wings extent mm
X weight Weight g
X lbh Length of beak and head mm
X lhum Length of humerus mm
X lfem Length of femur mm
X ltibio Length of tibiotarsus mm
X wskull Width of skull mm
X lkeel Length of keel to sternum mm
I have a following boxplot generated from the dataset sparrows.csv :
would be please possible to explain to me what is depicted on the boxplot and what should I look for when analysing it
Step by Step Solution
There are 3 Steps involved in it
1 Expert Approved Answer
Step: 1 Unlock

Question Has Been Solved by an Expert!
Get step-by-step solutions from verified subject matter experts
Step: 2 Unlock
Step: 3 Unlock