

Question: This question needs 3 answers (A,B,C) please do not answer only one question or else find another question to answer. A. shown in picture B.
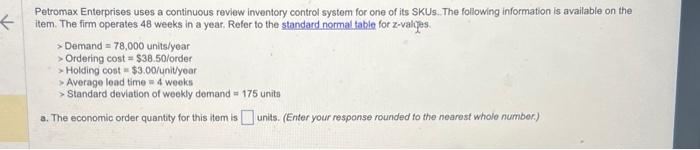
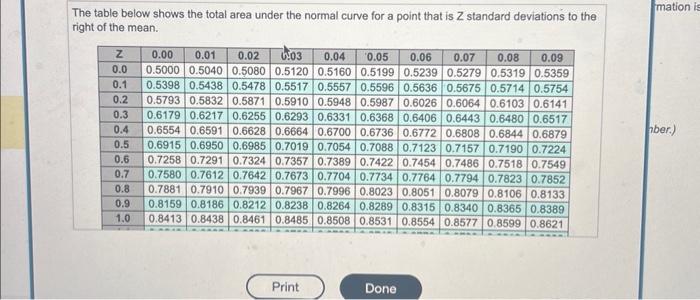
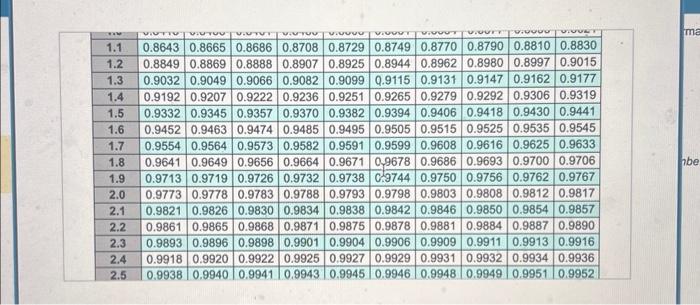
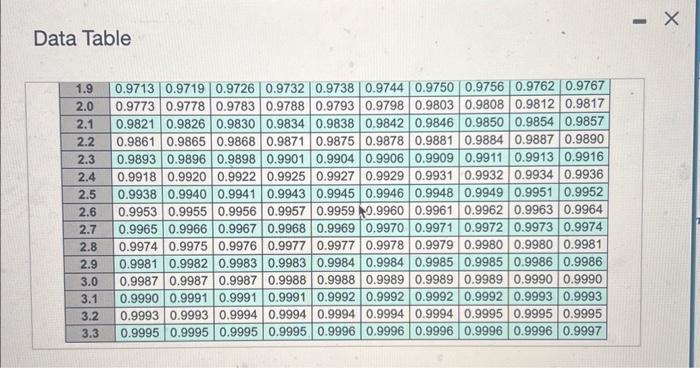
Petromax Enterprises uses a continuous review inventory control system for one of its SKUs. The following information is available on the item. The firm operates 48 weeks in a year. Refer to the standard normal table for z-valyes. > Demand =78,000 units/year > Ordering cost =$38.50/ order > Holding cost =$3.00/ unityeor > Average lead time =4 weeks > Standard deviation of weekly demand =175 units a. The economic order quantity for this item is units. (Enter your response rounded to the nearest wholo number.) The table below shows the total area under the normal curve for a point that is Z standard deviations to the right of the mean. \begin{tabular}{|l|l|l|l|l|l|l|l|l|l|l|} \hline \multirow{2}{*}{1.1} & 0.8643 & 0.8665 & 0.8686 & 0.8708 & 0.8729 & 0.8749 & 0.8770 & 0.8790 & 0.8810 & 0.8830 \\ \hline 1.2 & 0.8849 & 0.8869 & 0.8888 & 0.8907 & 0.8925 & 0.8944 & 0.8962 & 0.8980 & 0.8997 & 0.9015 \\ \hline 1.3 & 0.9032 & 0.9049 & 0.9066 & 0.9082 & 0.9099 & 0.9115 & 0.9131 & 0.9147 & 0.9162 & 0.9177 \\ \hline 1.4 & 0.9192 & 0.9207 & 0.9222 & 0.9236 & 0.9251 & 0.9265 & 0.9279 & 0.9292 & 0.9306 & 0.9319 \\ \hline 1.5 & 0.9332 & 0.9345 & 0.9357 & 0.9370 & 0.9382 & 0.9394 & 0.9406 & 0.9418 & 0.9430 & 0.9441 \\ \hline 1.6 & 0.9452 & 0.9463 & 0.9474 & 0.9485 & 0.9495 & 0.9505 & 0.9515 & 0.9525 & 0.9535 & 0.9545 \\ \hline 1.7 & 0.9554 & 0.9564 & 0.9573 & 0.9582 & 0.9591 & 0.9599 & 0.9608 & 0.9616 & 0.9625 & 0.9633 \\ \hline 1.8 & 0.9641 & 0.9649 & 0.9656 & 0.9664 & 0.9671 & 09978 & 0.9686 & 0.9693 & 0.9700 & 0.9706 \\ \hline 1.9 & 0.9713 & 0.9719 & 0.9726 & 0.9732 & 0.9738 & 0.9744 & 0.9750 & 0.9756 & 0.9762 & 0.9767 \\ \hline 2.0 & 0.9773 & 0.9778 & 0.9783 & 0.9788 & 0.9793 & 0.9798 & 0.9803 & 0.9808 & 0.9812 & 0.9817 \\ \hline 2.1 & 0.9821 & 0.9826 & 0.9830 & 0.9834 & 0.9838 & 0.9842 & 0.9846 & 0.9850 & 0.9854 & 0.9857 \\ \hline 2.2 & 0.9861 & 0.9865 & 0.9868 & 0.9871 & 0.9875 & 0.9878 & 0.9881 & 0.9884 & 0.9887 & 0.9890 \\ \hline 2.3 & 0.9893 & 0.9896 & 0.9898 & 0.9901 & 0.9904 & 0.9906 & 0.9909 & 0.9911 & 0.9913 & 0.9916 \\ \hline 2.4 & 0.9918 & 0.9920 & 0.9922 & 0.9925 & 0.9927 & 0.9929 & 0.9931 & 0.9932 & 0.9934 & 0.9936 \\ \hline 2.5 & 0.9938 & 0.9940 & 0.9941 & 0.9943 & 0.9945 & 0.9946 & 0.9948 & 0.9949 & 0.9951 & 0.9952 \\ \hline \end{tabular} Data Table
Step by Step Solution
There are 3 Steps involved in it

Get step-by-step solutions from verified subject matter experts