

Question: This question refers to Activity 7-2 in the workbook. It won't make sense unless you follow along in the workbook. Even though it doesn't
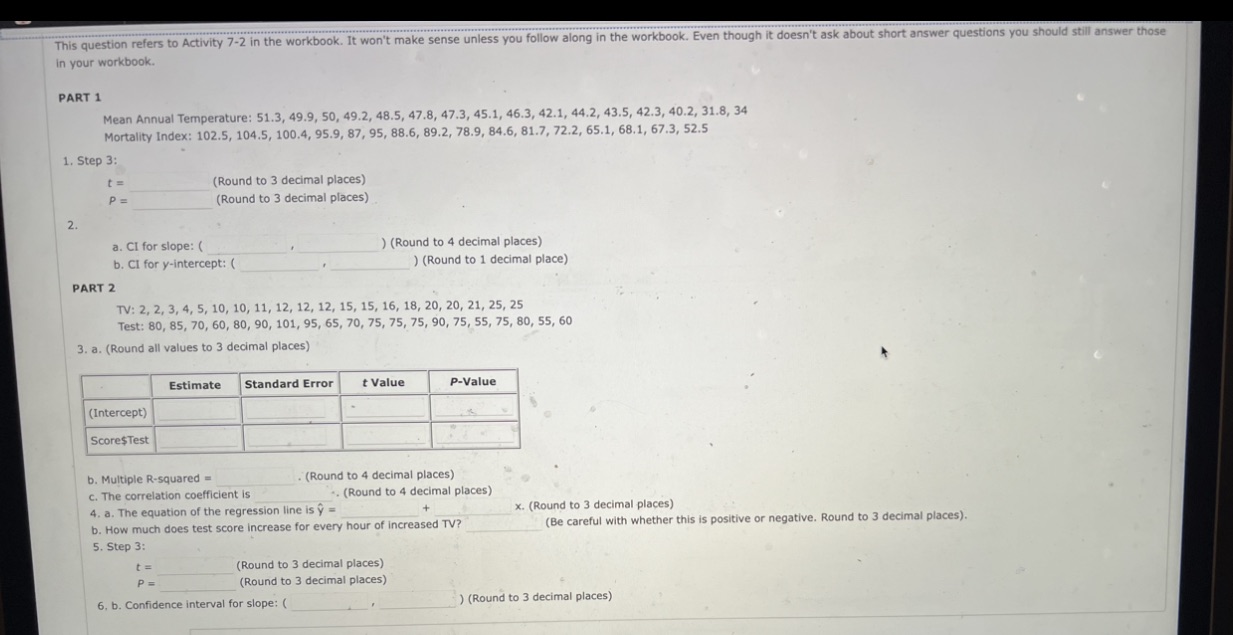
This question refers to Activity 7-2 in the workbook. It won't make sense unless you follow along in the workbook. Even though it doesn't ask about short answer questions you should still answer those in your workbook. PART 1 Mean Annual Temperature: 51.3, 49.9, 50, 49.2, 48.5, 47.8, 47.3, 45.1, 46.3, 42.1, 44.2, 43.5, 42.3, 40.2, 31.8, 34 Mortality Index: 102.5, 104.5, 100.4, 95.9, 87, 95, 88.6, 89.2, 78.9, 84.6, 81.7, 72.2, 65.1, 68.1, 67.3, 52.5 1. Step 3: t = P = (Round to 3 decimal places) (Round to 3 decimal places) 2. a. CI for slope: ( b. CI for y-intercept: ( PART 2 ) (Round to 4 decimal places) ) (Round to 1 decimal place) TV: 2, 2, 3, 4, 5, 10, 10, 11, 12, 12, 12, 15, 15, 16, 18, 20, 20, 21, 25, 25 Test: 80, 85, 70, 60, 80, 90, 101, 95, 65, 70, 75, 75, 75, 90, 75, 55, 75, 80, 55, 60 3. a. (Round all values to 3 decimal places) Estimate Standard Error t Value P-Value (Intercept) Score$Test b. Multiple R-squared = c. The correlation coefficient is (Round to 4 decimal places) (Round to 4 decimal places) + x. (Round to 3 decimal places) 4. a. The equation of the regression line is = b. How much does test score increase for every hour of increased TV? 5. Step 3: t= P = (Round to 3 decimal places) (Round to 3 decimal places) 6. b. Confidence interval for slope: ( (Be careful with whether this is positive or negative. Round to 3 decimal places). ) (Round to 3 decimal places)
Step by Step Solution
There are 3 Steps involved in it

Get step-by-step solutions from verified subject matter experts