

Question: This question refers to the utility function and indifference curve equations below the Parameter table. Use the equation for the indifference curve for a given
This question refers to the utility function and indifference curve equations below the Parameter table. Use the equation for the indifference curve for a given level of utility to calculate a set of plot points. Each set of plot points is for one indifference curve (IC1 and IC2). Based on the given levels of utility indicated, calculate a set of points (in the Table of plot points, for the range given) for:
(i) U1 (using the equation for IC1) and,
(ii) U2 (using the equation for IC2).
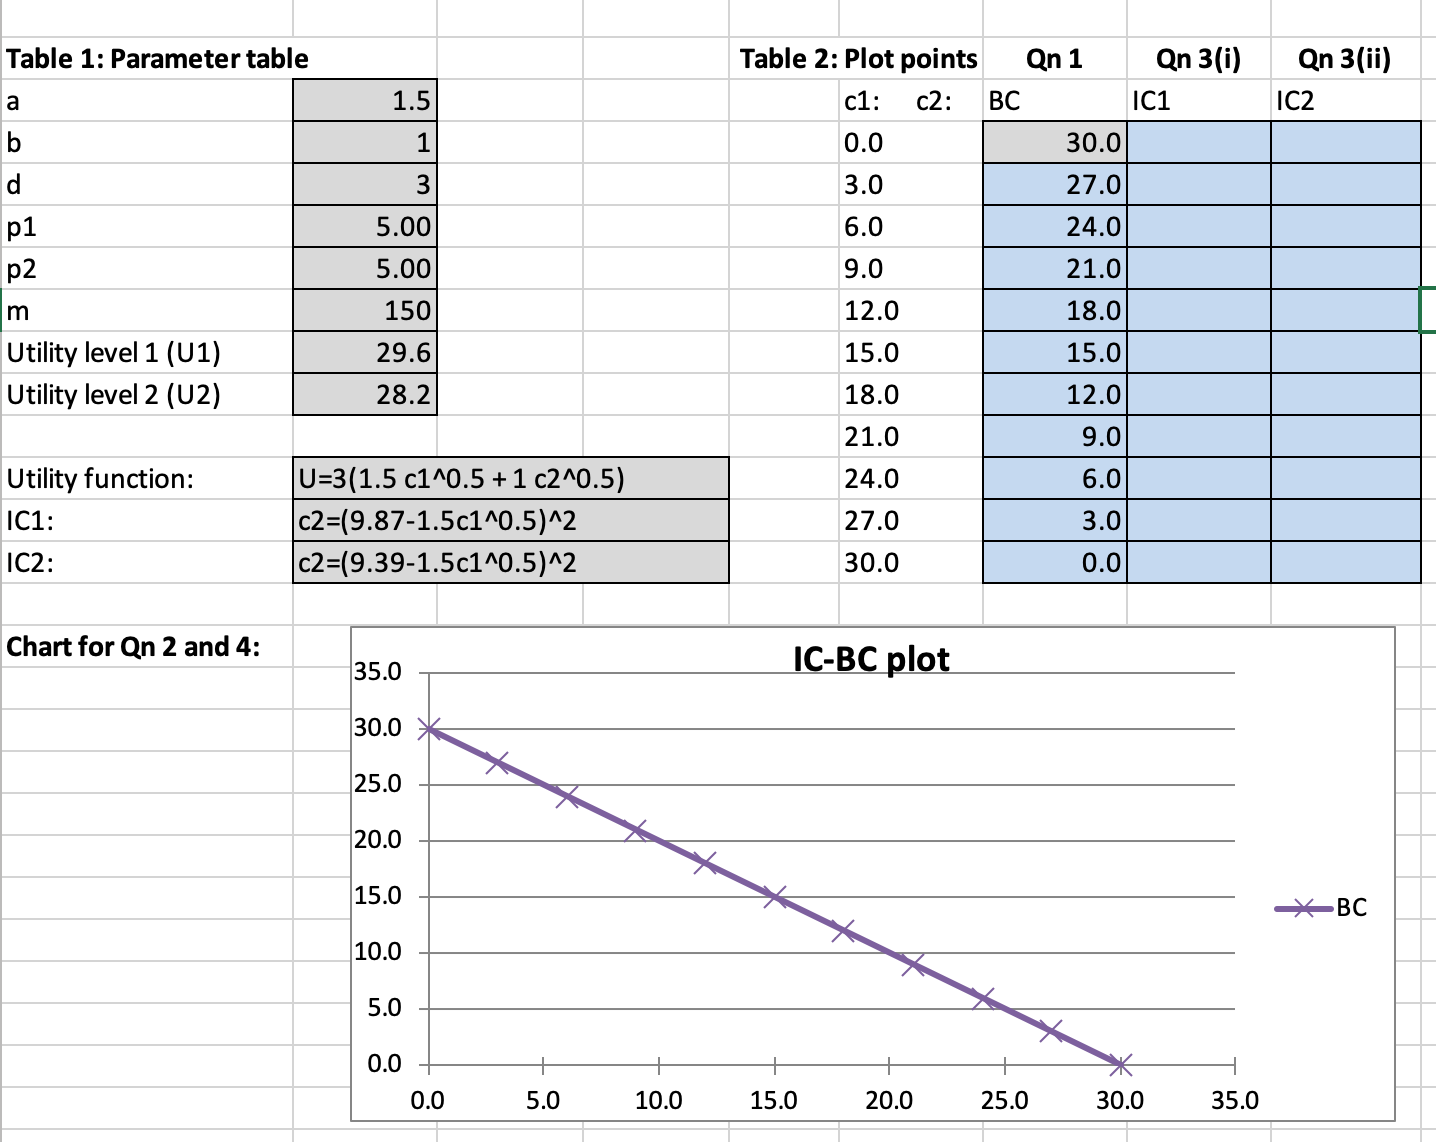
Table 1: Parameter table Table 2: Plot points Qn 1 Qn 3(i) Qn 3 (ii) a 1.5 c1: c2: BC IC1 IC2 b 1 0.0 30.0 d 3 3.0 27.0 p1 5.00 6.0 24.0 p2 5.00 9.0 21.0 m 150 12.0 18.0 Utility level 1 (U1) 29.6 15.0 15.0 Utility level 2 (U2) 28.2 18.0 12.0 21.0 9.0 Utility function: U=3(1.5 c1^0.5 + 1 c2^0.5) 24.0 6.0 IC1: c2=(9.87-1.5c1^0.5)^2 27.0 3.0 IC2: c2=(9.39-1.5c1^0.5)^2 30.0 0.0 Chart for Qn 2 and 4: 35.0 IC-BC plot 30.0 25.0 20.0 15.0 BC 10.0 5.0 0.0 0.0 5.0 10.0 15.0 20.0 25.0 30.0 35.0
Step by Step Solution
There are 3 Steps involved in it

Get step-by-step solutions from verified subject matter experts