

Question: This question relates to the patterns that occur when trying to draw inferences about one or two population means or population proportions. It is assumed
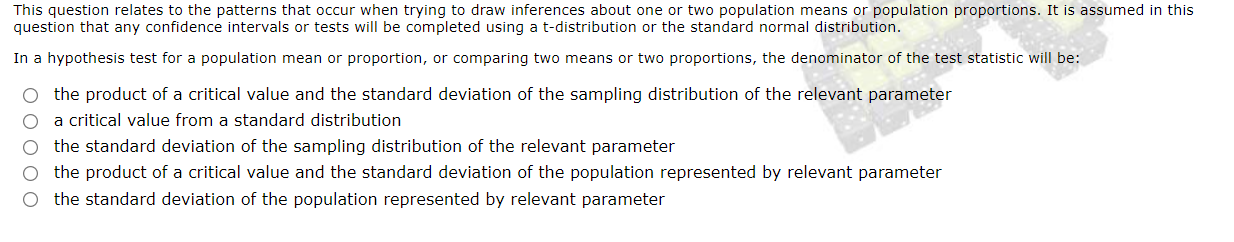
This question relates to the patterns that occur when trying to draw inferences about one or two population means or population proportions. It is assumed in this question that any confidence intervals or tests will be completed using a t-distribution or the standard normal distribution. In a hypothesis test for a population mean or proportion, or comparing two means or two proportions, the denominator of the test statistic will be: O the product of a critical value and the standard deviation of the sampling distribution of the relevant parameter O a critical value from a standard distribution O the standard deviation of the sampling distribution of the relevant parameter O the product of a critical value and the standard deviation of the population represented by relevant parameter O the standard deviation of the population represented by relevant parameter
Step by Step Solution
There are 3 Steps involved in it

Get step-by-step solutions from verified subject matter experts