

Question: This question Submit quiz The following stem-and-leaf plot shows the daily high temperature in a town on April 1 for twenty-four random years. Which measures
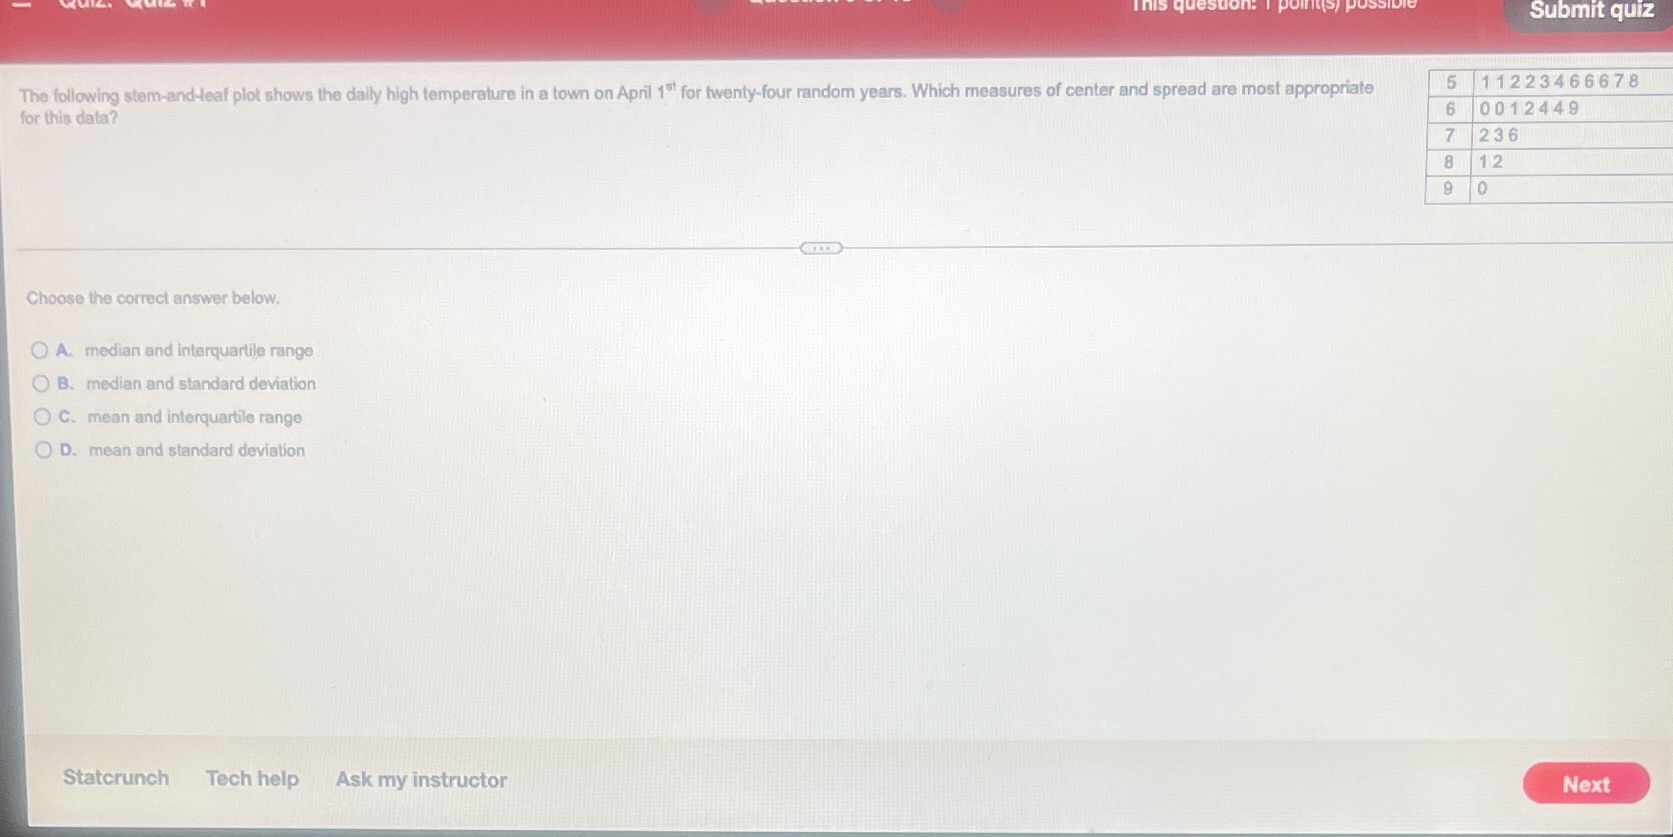

This question Submit quiz The following stem-and-leaf plot shows the daily high temperature in a town on April 1" for twenty-four random years. Which measures of center and spread are most appropriate 5 1 122346 6 6 7 8 for this data? 6 0012449 7 236 8 12 9 Choose the correct answer below. O A. median and interquartile range O B. median and standard deviation O C. mean and interquartile range D. mean and standard deviation Statcrunch Tech help Ask my instructor Next
Step by Step Solution
There are 3 Steps involved in it
1 Expert Approved Answer
Step: 1 Unlock

Question Has Been Solved by an Expert!
Get step-by-step solutions from verified subject matter experts
Step: 2 Unlock
Step: 3 Unlock