

Question: This scatterplot shows the performance of an electric motor using the variables speed of rotation and voltage. Select the answer choice that accurately describes the
This scatterplot shows the performance of an electric motor using the variables speed of rotation and voltage.
Select the answer choice that accurately describes the data's form, direction, and strength in the scatterplot.
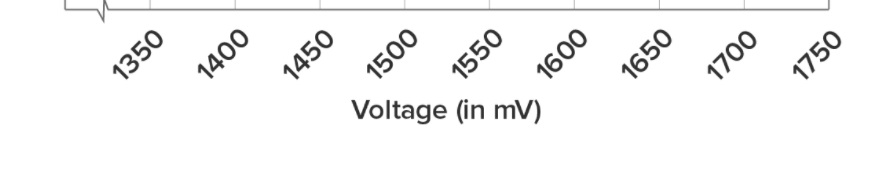
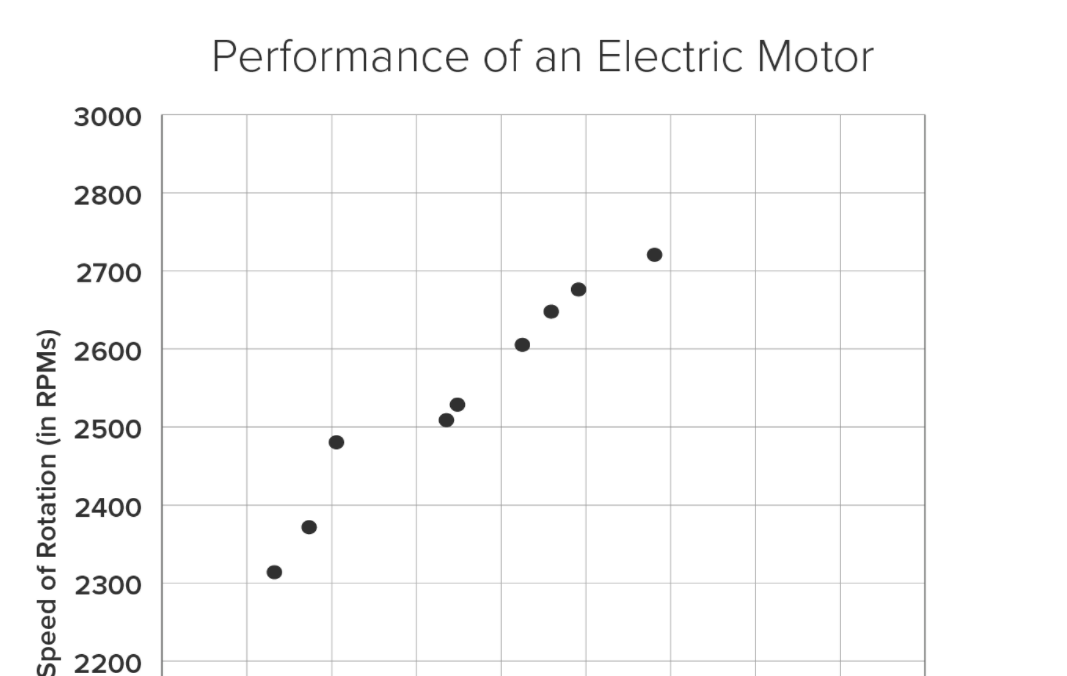
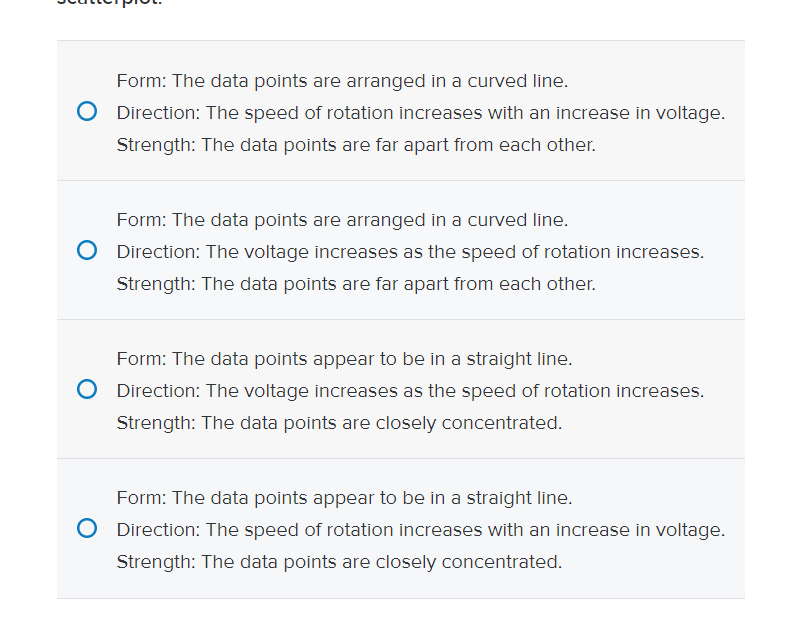
1350 1400 1450 1500 1550 Voltage (in mV) 1600 1650 1700 1750Performance of an Electric Motor 3000 2800 2700 2600 2500 Speed of Rotation (in RPMs) 2400 2300 2200\"HUI-I'll Plut- Form: The data points are arranged in a curved line. 0 Direction: The speed of rotation increases with an increase in voltage. Strength: The data points are far apart from each other. Form: The data points are arranged in a curved line. 0 Direction: The voltage increases as the speed of rotation increases. Strength: The data points are far apart from each other. Form: The data points appear to be in a straight line. 0 Direction: The voltage increases as the speed of rotation increases. Strength: The data points are closely concentrated. Form: The data points appear to be in a straight line. 0 Direction: The speed of rotation increases with an increase in voltage. Strength: The data points are closely concentrated
Step by Step Solution
There are 3 Steps involved in it

Get step-by-step solutions from verified subject matter experts