

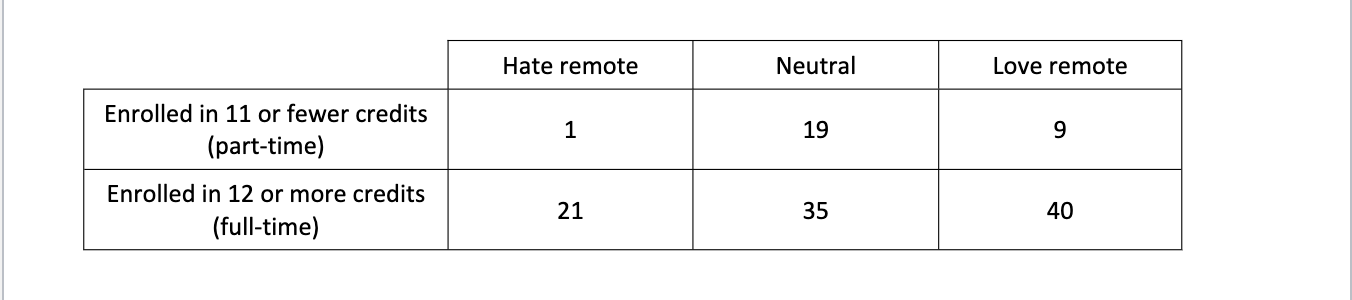
Question: This table is based on data from the Student Info Survey from this term (sampled from all of Kelsi's statistics students). It compares the enrollment
This table is based on data from the Student Info Survey from this term (sampled from all of
Kelsi's statistics students). It compares the enrollment variable (split into categories: enrolled in 11 or fewer
credits this term or enrolled in 12 or more credits this term) with the remote classes sentiment variable (How
students feel about taking remote classes: hate, love, or feel neutral). Typically, undergraduate programs
consider 12 or more credits as "full-time" enrollment, while classifying 11 or fewer credits as "part-time."
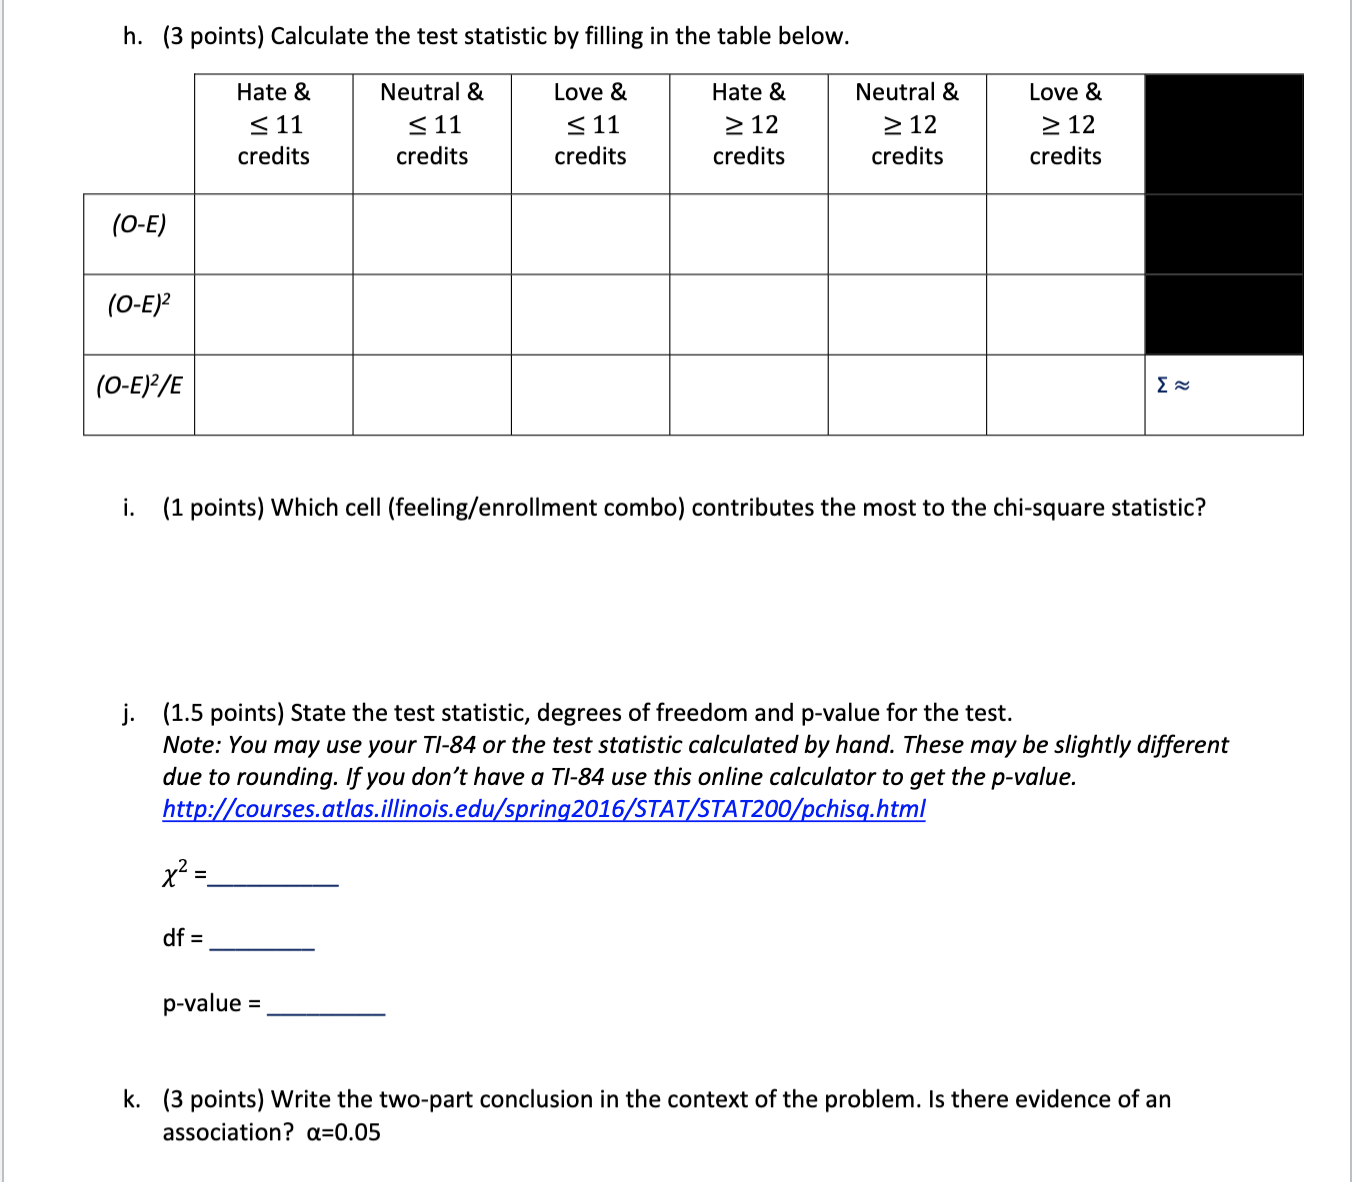
h. (3 points) Calculate the test statistic by filling in the table below. Hate & Neutral & Love & Hate & Neutral & Love & 11 11 $ 11 2 12 2 12 2 12 credits credits credits credits credits credits (0-E) (0-E) (0-E)2/E i. (1 points) Which cell (feeling/enrollment combo) contributes the most to the chi-square statistic? j. (1.5 points) State the test statistic, degrees of freedom and p-value for the test. Note: You may use your TI-84 or the test statistic calculated by hand. These may be slightly different due to rounding. If you don't have a TI-84 use this online calculator to get the p-value. http://courses.atlas.illinois.edu/spring2016/STAT/STAT200/pchisq.html xz = df = p-value = k. (3 points) Write the two-part conclusion in the context of the problem. Is there evidence of an association? a=0.05Hate remote Neutral Love remote Enrolled in 11 or fewer credits (part-time) Enrolled in 12 or more credits (full-time)
Step by Step Solution
There are 3 Steps involved in it

Get step-by-step solutions from verified subject matter experts