

Question: This table presents summary measures of performance and summary statistics for each of the three groups of the equity mutual funds. Growth Funds Income Balanced
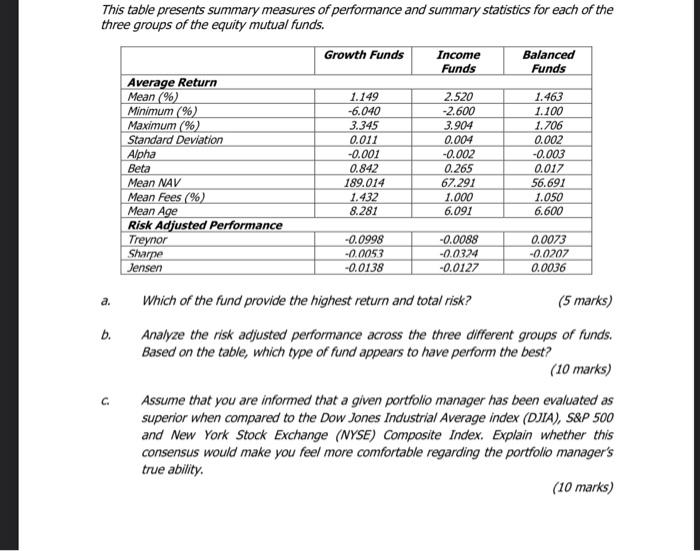
This table presents summary measures of performance and summary statistics for each of the three groups of the equity mutual funds. Growth Funds Income Balanced Funds Funds Average Return Mean (%) 1.149 2.520 1.463 Minimum (%) -6.040 -2.600 1.100 Maximum (%) 3.345 3.904 1.706 Standard Deviation 0.011 0.004 0.002 Alpha -0.001 -0.002 -0.003 Beta 0.842 0.265 0.017 Mean NAV 189.014 67.291 56.691 Mean Fees (%) 1.432 1.000 1.050 Mean Age 8.281 6.091 6.600 Risk Adjusted Performance Treynor -0.0998 -0.0088 0.0073 Sharpe -0.0053 -0.0324 -0.0207 Jensen -0.0138 -0.0127 0.0036 a. Which of the fund provide the highest return and total risk? (5 marks) b. Analyze the risk adjusted performance across the three different groups of funds. Based on the table, which type of fund appears to have perform the best? (10 marks) C. Assume that you are informed that a given portfolio manager has been evaluated as superior when compared to the Dow Jones Industrial Average index (DJIA), S&P 500 and New York Stock Exchange (NYSE) Composite Index. Explain whether this consensus would make you feel more comfortable regarding the portfolio manager's true ability. (10 marks)
Step by Step Solution
There are 3 Steps involved in it

Get step-by-step solutions from verified subject matter experts