

Question: This task should be done on paper and bring to the tutorial session. Clearly show all the calculations that you used. You can check
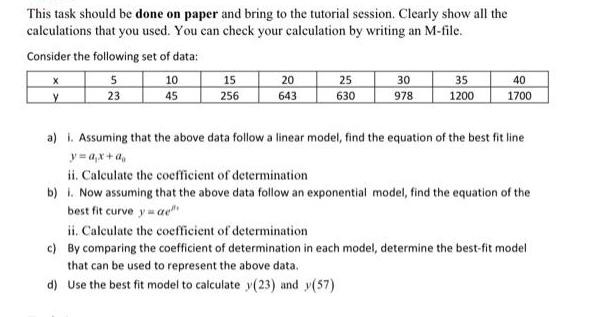
This task should be done on paper and bring to the tutorial session. Clearly show all the calculations that you used. You can check your calculation by writing an M-file. Consider the following set of data: 5 23 X y 10 45 15 256 20 643 25 630 30 978 35 1200 40 1700 a) i. Assuming that the above data follow a linear model, find the equation of the best fit line y=ax + a ii. Calculate the coefficient of determination b) i. Now assuming that the above data follow an exponential model, find the equation of the best fit curve ya ii. Calculate the coefficient of determination c) By comparing the coefficient of determination in each model, determine the best-fit model that can be used to represent the above data. d) Use the best fit model to calculate y(23) and y(57)
Step by Step Solution
3.49 Rating (149 Votes )
There are 3 Steps involved in it
Solutions Step 1 a Linear model To find the equation of the best fit line we can use the following steps Calculate the mean and standard deviation of ... View full answer

Get step-by-step solutions from verified subject matter experts