

Question: This was based upon loan data and the lenders risk assessment 1.explain how a data analyst would interpret these histograms. What do they mean when
This was based upon loan data and the lenders risk assessment
1.explain how a data analyst would interpret these histograms. What do they mean when you look at them?
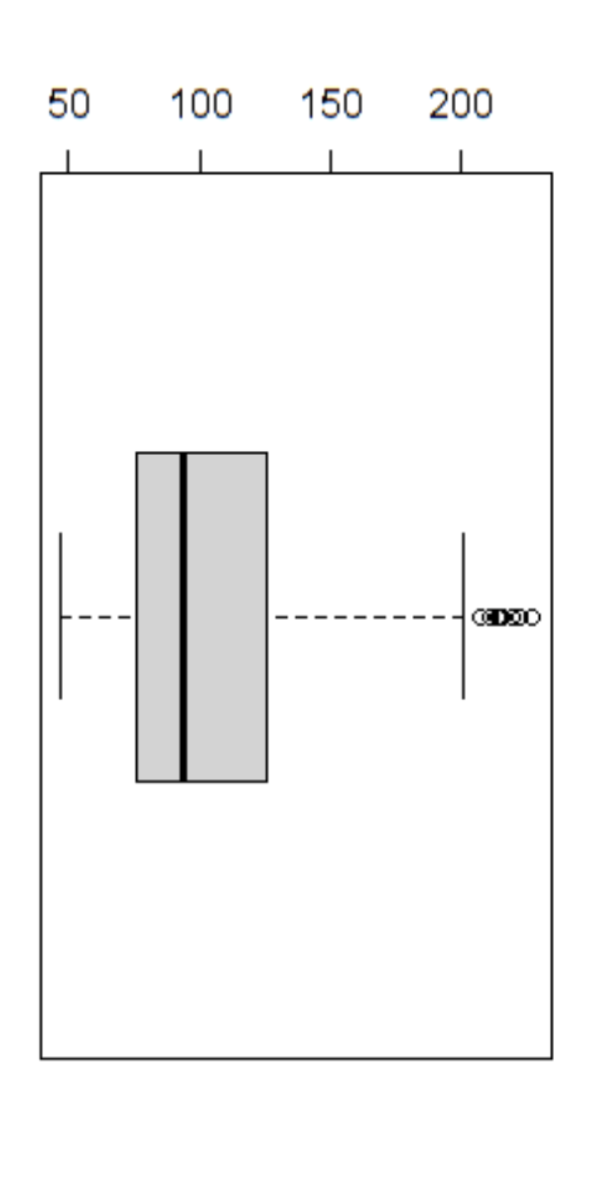
2.Explain how a data analyst would interpret the boxplot. What does it mean when you look at it?
3.correlation matrix in your Word document and explain which two sets of variables are the
4.What does the t-test result mean in terms of Credit Score's influence on Make Loan?
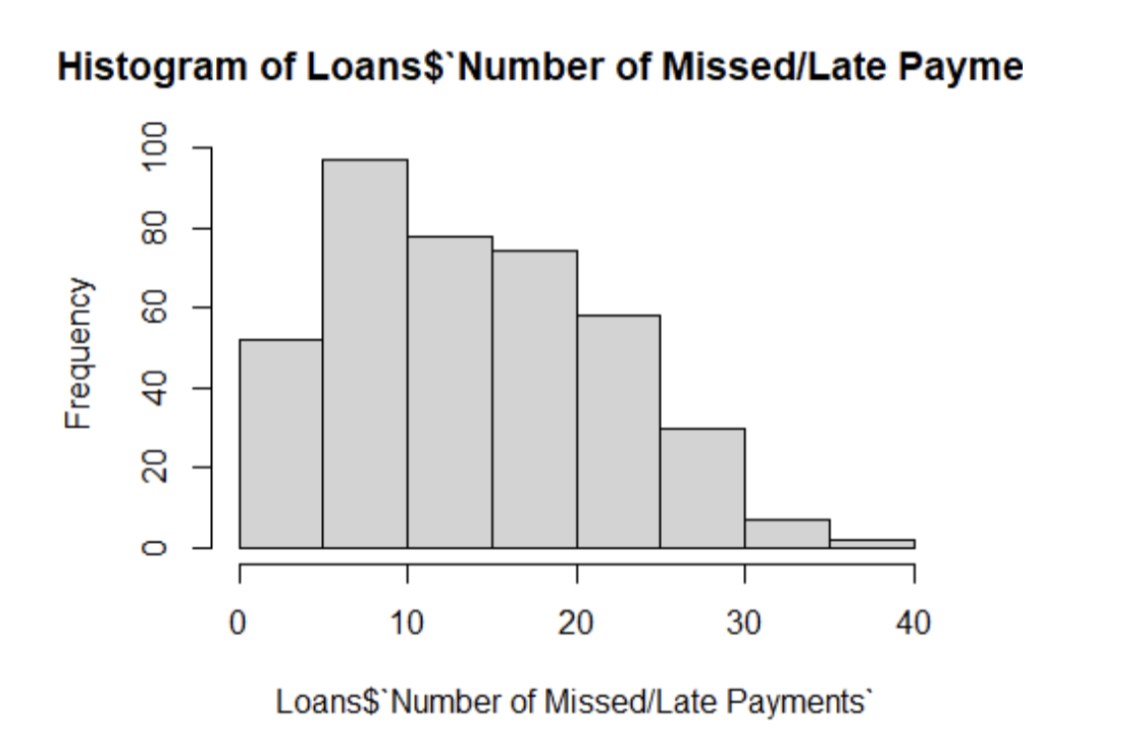
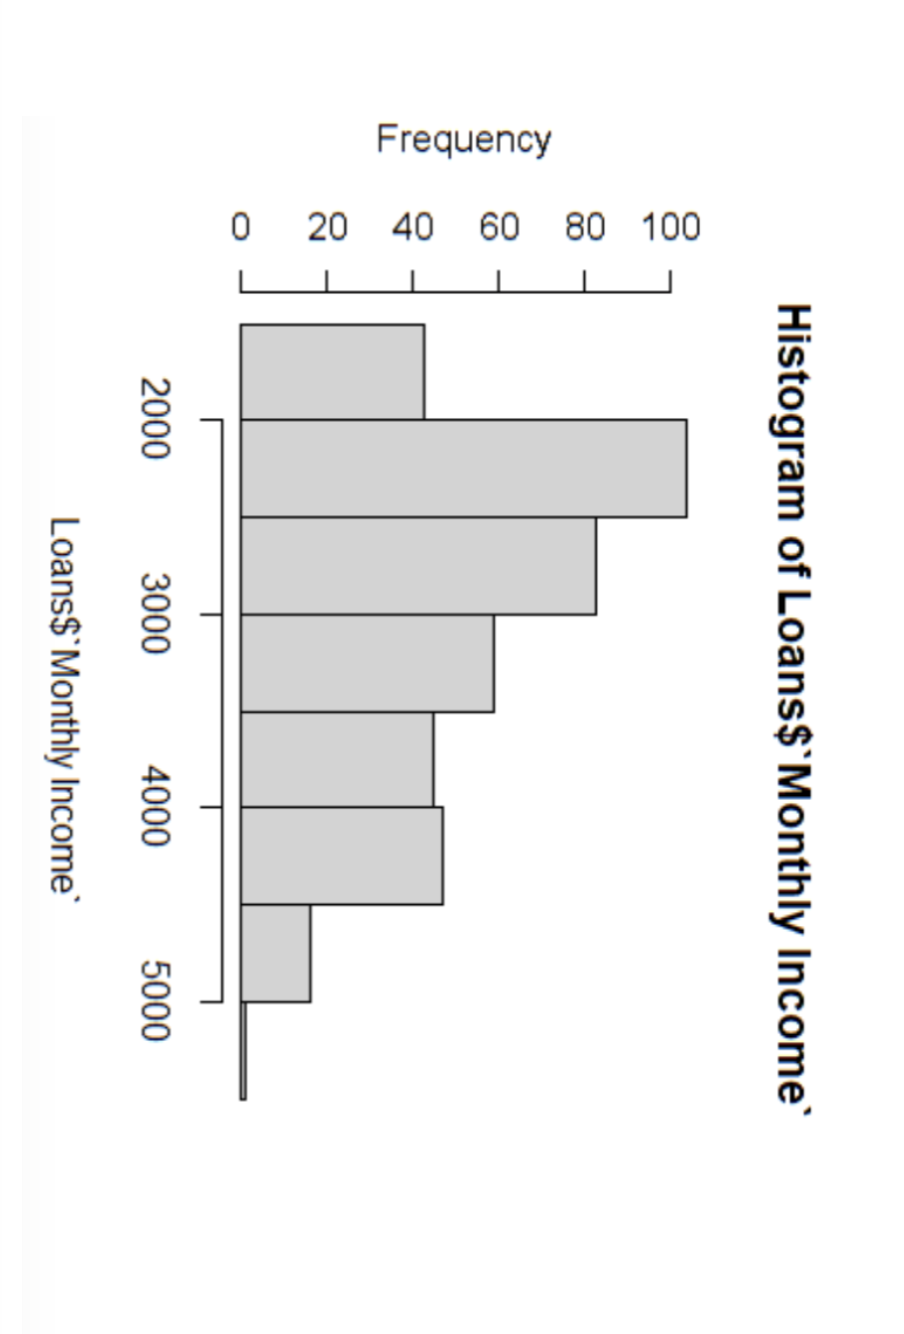
Histogram of Loans\$'Number of Missed/Late Payme Loans\$'Number of Missed/Late Payments' Histogram of Loans\$'Monthly Income` Histogram of Loans\$'Number of Missed/Late Payme Loans\$'Number of Missed/Late Payments' Histogram of Loans\$'Monthly Income`
Step by Step Solution
There are 3 Steps involved in it

Get step-by-step solutions from verified subject matter experts