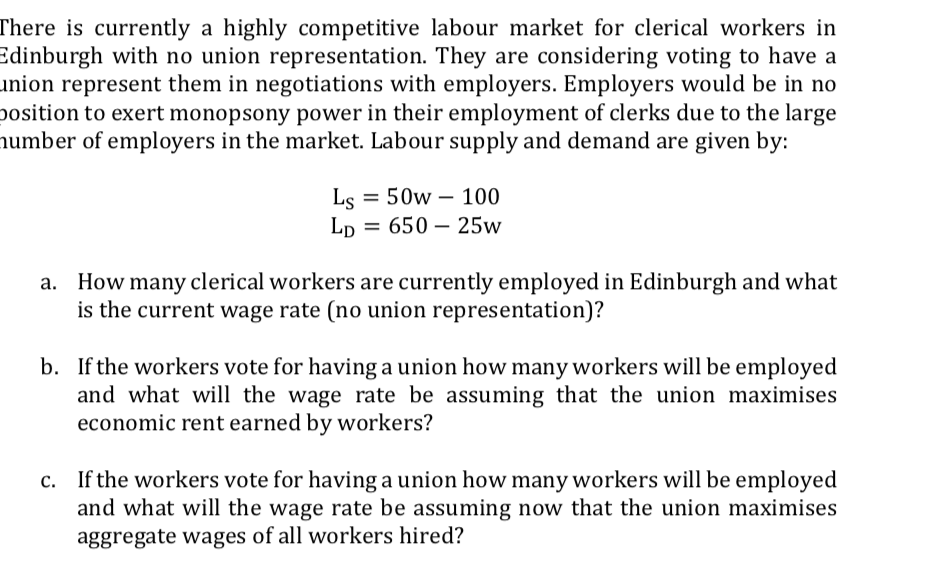
Question: .This will give five star rating. l'here is currently a highly competitive labour market for clerical workers in Edinburgh with no union representation. They are

.This will give five star rating.

.This will give five star rating. l'here is.This will give five star rating. l'here is.This will give five star rating. l'here is
l'here is currently a highly competitive labour market for clerical workers in Edinburgh with no union representation. They are considering voting to have a .lI'liOIl represent them in negotiations with employers. Employers would be in no Josition to exert monopsony power in their employment of clerks due to the large number of employers in the market. Labour supply and demand are given by: L8 = 50w 100 Ln = 650 - 25w a. How many clerical workers are currently employed in Edinburgh and what is the current wage rate [no union representation]? b. If the workers vote for having a union how many workers will be employed and what will the wage rate be assuming that the union maximises economic rent earned by workers? c. If the workers vote for having a union how many workers will be employed and what will the wage rate be assuming now that the union maximises aggregate wages of all workers hired? You have been given the following table from a. prospective study of deaths in tunnel and bridge workers in New York City. NYC Tunnel Workers NYC Bridge Workers Age Person- # Deaths Age-Specific Person- # Deaths Age-Specic Category Years Observed Mortality Years Observed Mortality er uer 11,000 ' 11 ' 1,000 5 3,500 5 1,500 ' '18 ' s 32 7,500 3,500 Crude Mortality (Tunnel): Crude Mortality (Bridge): Crude Mortality Ratio: a. Calculate the crude mortality rates and the crude mortality ratio (reference group = bridge workers). Interpret these results. b. Fill the age-specific mortality rates in the table and interpret these results. (2. Using the table below, calculate the age-adjusted mortality rates and the age-adjusted mortality ratio (reference = bridge workers) using the combined person-years for the two groups as the standard population [please Show your work in detail]. Briey explain what you did and briey discuss what these results mean. TUNNEL WORK EHS BRIDGE WORKERS , , Combined . Age-Specrc Expected Standard Age-Specrc Age Martairty Deaths Population Mortality 105,500 3. Follow the analysis we did in class to build your demand curve (just like the 'Facebook' example): Suppose that there are 200 people in a market for a new fitness app. Maybe it's fun to log into your own account and admire your own results and records and there- fore consumers have a value for this feature alone. This base value, v, for access to the account is uniformly distributed between $1 and $50. But there's a social aspect to the site that causes it to exhibit network externalities (e.g. Strava, for example). Suppose that the total value to person v is v .n where n is the number of people who are also consuming the good. Imagine access to the app can be supplied through a constant returns to scale technology so the supply curve is a flat line at the price level that equals average cost. Assume this average cost is $979 (users upload a tremendous amount of content!). (a) 4 points At some given point in time there's 11 users on the app. What happens to the network size? Explain! (b) 4 points At some given point in time there's 30 users on the app. What happens to the network size? Explain! (c) 4 points At some given point in time there's 60 users on the app. What happens to the network size? Explain

Step by Step Solution

There are 3 Steps involved in it

1 Expert Approved Answer
Step: 1 Unlock blur-text-image
Question Has Been Solved by an Expert!

Get step-by-step solutions from verified subject matter experts

Step: 2 Unlock
Step: 3 Unlock

Students Have Also Explored These Related Accounting Questions!