

Question: This window shows your responses and what was marked correct and incorrect from your previous atpt. le The table below contains data on Fincorp Inc.
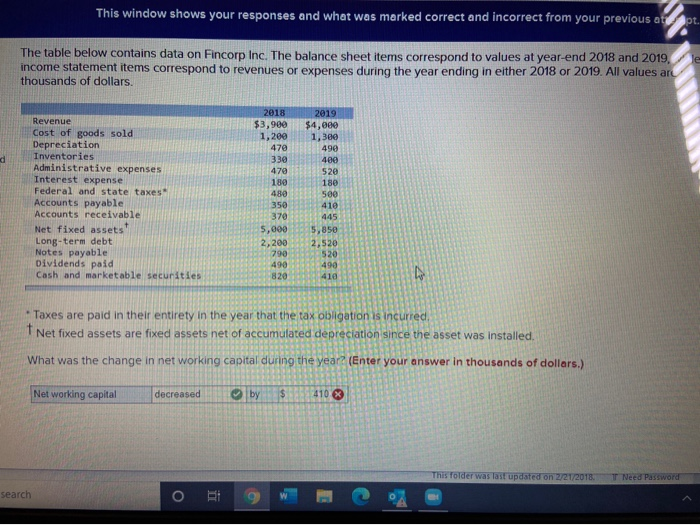
This window shows your responses and what was marked correct and incorrect from your previous atpt. le The table below contains data on Fincorp Inc. The balance sheet items correspond to values at year-end 2018 and 2019, income statement items correspond to revenues or expenses during the year ending in either 2018 or 2019. All values are thousands of dollars. d Revenue Cost of goods sold Depreciation Inventories Administrative expenses Interest expense Federal and state taxes Accounts payable Accounts receivable Net fixed assets Long-term debt Notes payable Dividends paid Cash and marketable securities 2018 $3,900 1,200 470 330 479 180 480 350 370 5,000 2,200 790 490 820 2019 $4,000 1,300 490 400 520 180 500 410 445 5,850 2,520 520 490 410 Taxes are paid in their entirety in the year that the tax obligation is incurred, Net fixed assets are fixed assets net of accumulated depreciation since the asset was installed, What was the change in net working capital during the year? (Enter your answer in thousands of dollars.) Networking capital decreased by 410 This folder was last updated on 2/21/2018 T Need Password search
Step by Step Solution
There are 3 Steps involved in it

Get step-by-step solutions from verified subject matter experts