

Question: Three single sampling plans, Plan 1, Plan 2 and Plan 3, were proposed with their corresponding Type B OC curves shown in the figure
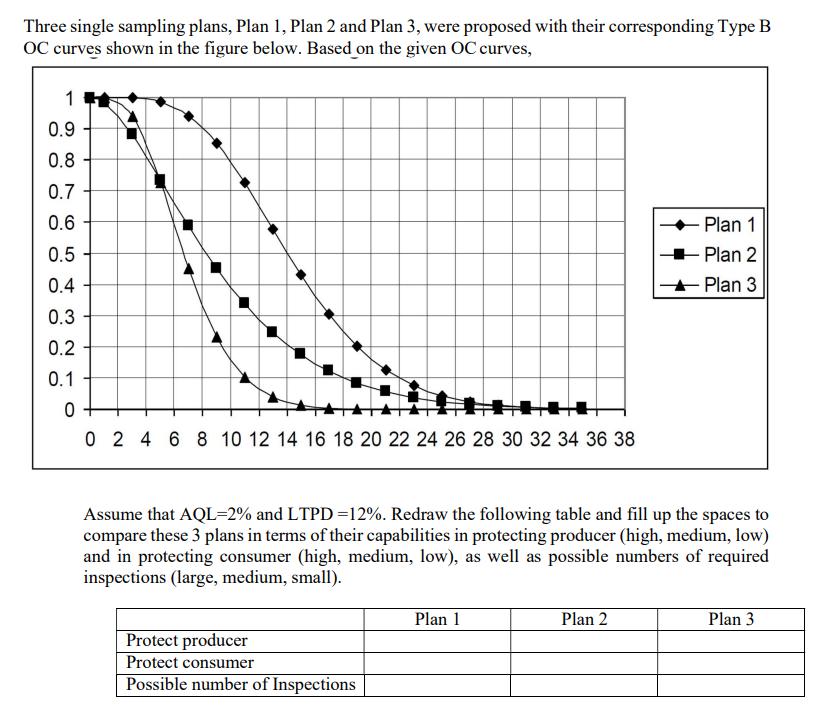
Three single sampling plans, Plan 1, Plan 2 and Plan 3, were proposed with their corresponding Type B OC curves shown in the figure below. Based on the given OC curves, 1 0.9 0.8 0.7 0.6 0.5 0.4 0.3 0.2 0.1 0 0 2 4 6 8 10 12 14 16 18 20 22 24 26 28 30 32 34 36 38 Assume that AQL=2% and LTPD=12%. Redraw the following table and fill up the spaces to compare these 3 plans in terms of their capabilities in protecting producer (high, medium, low) and in protecting consumer (high, medium, low), as well as possible numbers of required inspections (large, medium, small). Protect producer Protect consumer Possible number of Inspections Plan 1 Plan 1 Plan 2 Plan 3 Plan 2 Plan 3
Step by Step Solution
3.47 Rating (154 Votes )
There are 3 Steps involved in it
Assume that AQL 2 and LTPD 12 to compare Spaces in protecting the Here is the table ... View full answer

Get step-by-step solutions from verified subject matter experts