

Question: Through this picture , please solve this questions - (questions are based on Introductory Statistics Writer Prem S. Mann. Chapter 13 and 14) Plz have
Through this picture , please solve this questions - (questions are based on "Introductory Statistics" Writer Prem S. Mann. Chapter 13 and 14) Plz have a look before solving it.
a) What are the dependent and independent variables in this regression? Write the regression line? Is it
a multiple regression or simple regression?
b) Interpret the values of all coefficients and constants.
c) Do the hypothesis test for all independent variables at ? = 5% and 10%. Which variable is statically
insignificant?
d)Construct a 95% confidence for all independent variable?
e) Explain R-Squared and adjusted R squared in this regression. What is the value Standard deviation of
error in this above result?
g) Do F test and give the explanation if it's a multiple regression.
h) Explain RVF and AV plot. Run AV plot for all independent variables.
i)Construct scatter plot for all independent variables and mention whether it meets your expectations or not.
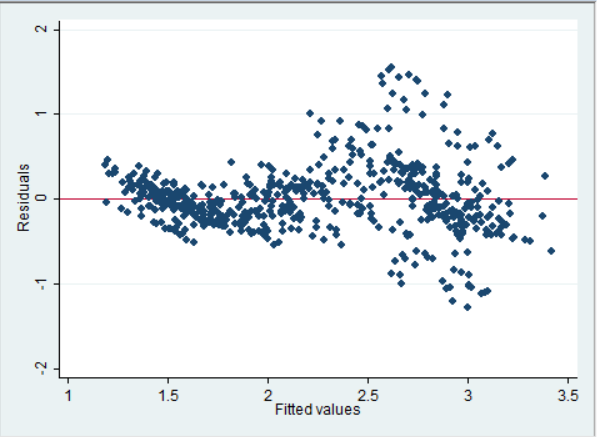
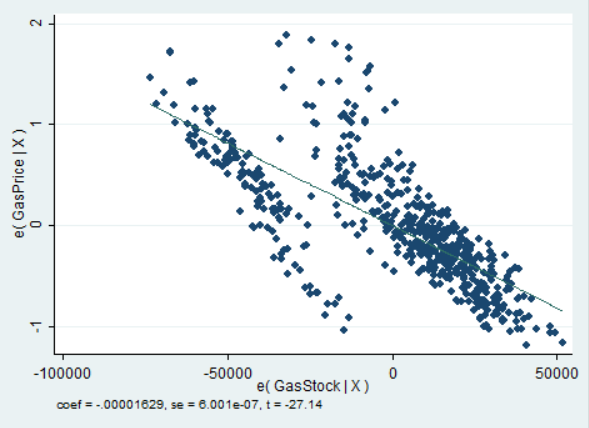
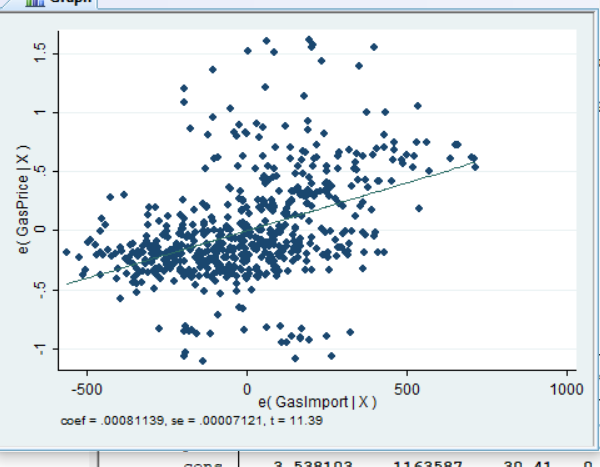

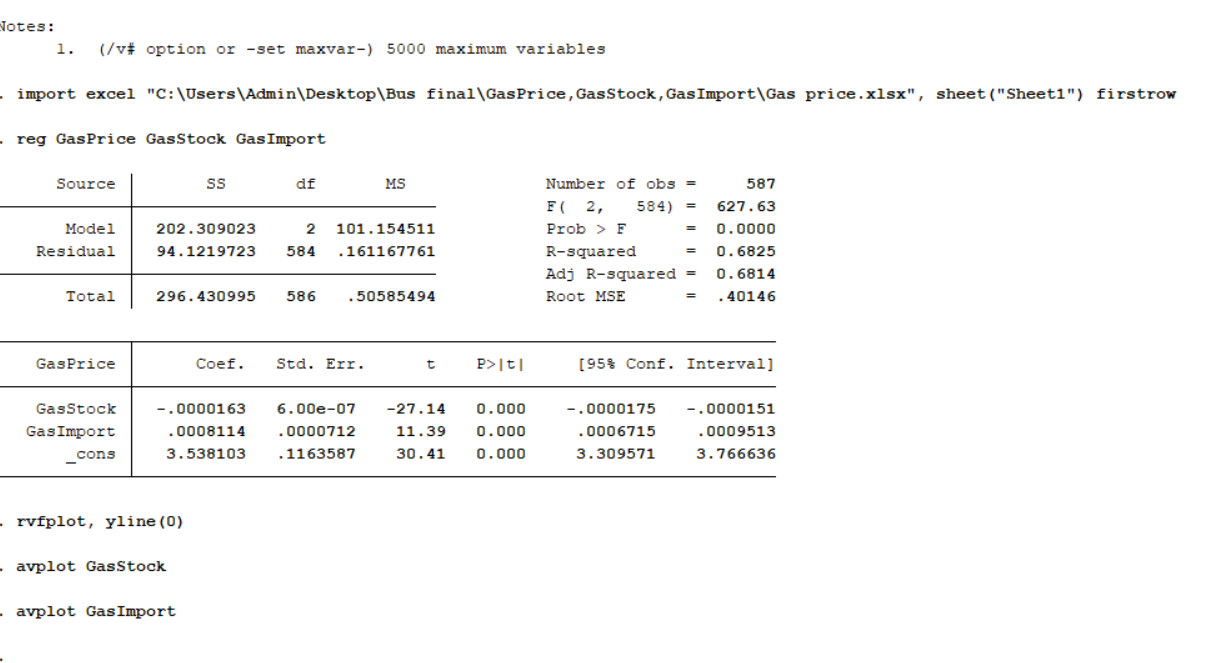
Residuals 1.5 2 2.5 3.5 Fitted valuese( GasPrice [ X ) O N -100000 -50000 0 50000 e( GasStock | X ) coef = -.00001629, se = 6.001e-07. t= -27.14LD e( GasPrice [ X ) O -500 0 500 1000 e( GasImport | X ) coef = .00081139, se = .00007121, t = 11.39Notes: 1. (/v# option or -set maxvar-) 5000 maximum variables import excel "C: \\Users\\Admin\\Desktop\\Bus final\\GasPrice, GasStock, GasImport\\Gas price. xisx", sheet ("Sheet1") firstrow reg GasPrice GasStock GasImport Source SS df MS Number of obs = 587 F( 2, 584) = 627 . 63 Model 202 . 309023 2 101 . 154511 Prob > F 0. 0000 Residual 94 . 1219723 584 . 161167761 R-squared = 0. 6825 Adj R-squared = 0. 6814 Total 296. 430995 586 . 50585494 Root MSE = . 40146 GasPrice Coef. Std. Err. t P>ItI [95% Conf. Interval] GasStock -. 0000163 6.00e-07 -27.14 0.000 - . 0000175 -. 0000151 GasImport . 0008114 . 0000712 11 .39 0. 000 . 0006715 . 0009513 cons 3. 538103 . 1163587 30 . 41 0 . 000 3. 309571 3. 766636 rvfplot, yline (0) avplot GasStock avplot GasImport
Step by Step Solution
There are 3 Steps involved in it

Get step-by-step solutions from verified subject matter experts