

Question: Throughout this course you have seen how reading and understanding a companys financial statements, and analyzing ratios based on the reported numbers, can provide valuable
Throughout this course you have seen how reading and understanding a companys financial statements, and analyzing ratios based on the reported numbers, can provide valuable about the financial condition of the company. Lesson 14 discusses additional resources for analyzing a company and comparing its results with other companies or industries. For this discussion, please look at one of the resources mentioned in the lesson either an online database or financial site mentioned in the Industry Information section, or an annual report or 10-K form for any company. Find an interesting fact or comparison to discuss. You may browse until you find something interesting, or look up something specific about a particular company or industry. Discuss how the information you found enhances your understanding of the company or industry beyond the reported numbers in the financial statements.
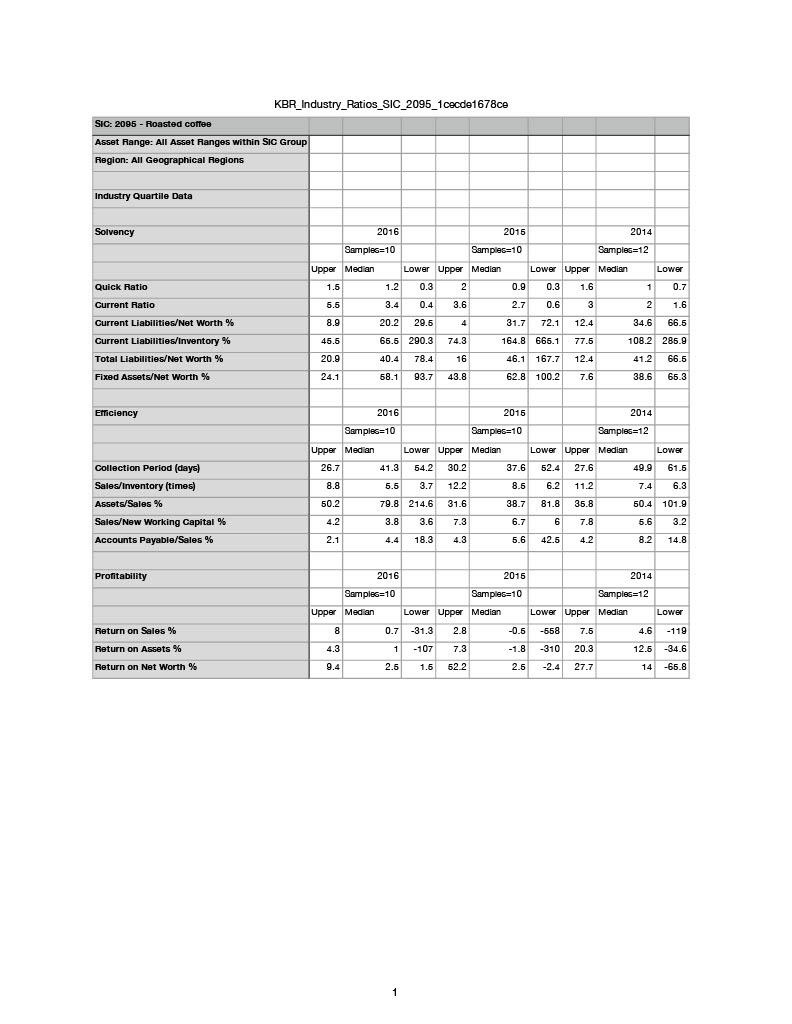
KBR_Industry_Ratios_SIC_2095_1cecde1678ce SIC: 2095 - Roasted coffee Asset Range: All Asset Ranges within Sic Group Region: All Geographical Regions Industry Quartile Data Solvency Quick Ratio Current Ratio Current Liabilities/Net Worth % Current Liabilities/Inventory % Total Liabilities/Net Worth % Fixed Assets/Net Worth % 2016 2015 2014 Samples=10 Samples=10 Samples=12 Upper Median L ower Upper Median Lower Upper Median Lower 1.2 0.3 2 0.9 0.3 1.6 10.7 5.5 3.4 0.4 3.6 2.7 0. 6 3 2 1.6 20.2 29.5 4 31.7 72.1 12.4 34.6 66.5 65.5 290.3 74.3 164.8 665.1 77.5 108.2 285.9 40.4 46.1 167.7 12.4 41.2 66.5 58.1 93.7 43.8 62.8 100.2 7.6 38.6 65.3 Efficiency Collection Period (days) Sales/Inventory (times) Assets/Sales % Sales/New Working Capital % Accounts Payable/Sales % 2016 2015 2014 Samples=10 Samples=10 Samples=12 Upper Median Lower Upper Median Lower Upper Median Lower 26.7 41.3 54.2 30.2 37.6 52.4 27.6 49.9 61.5 5.5 3.7 12.2 8.5 6.2 11.2 7.4 6.3 50.2 79.8 214.6 31.6 38.7 81.8 8 35. 5 0.4 101.9 3.8 3.6 7.3 6.7 6 7.8 5.6 3.2 4.4 18.3 4.3 5.6 42.5 4.2 8.2 14.8 Profitability 2016 2015 2014 Samples=10 Samples=10 Samples=12 Upper Median Lower Upper Median Lower Upper Median Lower 0.7 -31.3 2.8 -0.5 -558 7.5 4.6 -119 1 -107 7.3 -1.8 -310 20.3 12.5 -34.6 9.4 2.5 1.5 52.2 2.5 -2.4 27.7 14 -65.8 Return on Sales % Return on Assets % Return on Net Worth % KBR_Industry_Ratios_SIC_2095_1cecde1678ce SIC: 2095 - Roasted coffee Asset Range: All Asset Ranges within Sic Group Region: All Geographical Regions Industry Quartile Data Solvency Quick Ratio Current Ratio Current Liabilities/Net Worth % Current Liabilities/Inventory % Total Liabilities/Net Worth % Fixed Assets/Net Worth % 2016 2015 2014 Samples=10 Samples=10 Samples=12 Upper Median L ower Upper Median Lower Upper Median Lower 1.2 0.3 2 0.9 0.3 1.6 10.7 5.5 3.4 0.4 3.6 2.7 0. 6 3 2 1.6 20.2 29.5 4 31.7 72.1 12.4 34.6 66.5 65.5 290.3 74.3 164.8 665.1 77.5 108.2 285.9 40.4 46.1 167.7 12.4 41.2 66.5 58.1 93.7 43.8 62.8 100.2 7.6 38.6 65.3 Efficiency Collection Period (days) Sales/Inventory (times) Assets/Sales % Sales/New Working Capital % Accounts Payable/Sales % 2016 2015 2014 Samples=10 Samples=10 Samples=12 Upper Median Lower Upper Median Lower Upper Median Lower 26.7 41.3 54.2 30.2 37.6 52.4 27.6 49.9 61.5 5.5 3.7 12.2 8.5 6.2 11.2 7.4 6.3 50.2 79.8 214.6 31.6 38.7 81.8 8 35. 5 0.4 101.9 3.8 3.6 7.3 6.7 6 7.8 5.6 3.2 4.4 18.3 4.3 5.6 42.5 4.2 8.2 14.8 Profitability 2016 2015 2014 Samples=10 Samples=10 Samples=12 Upper Median Lower Upper Median Lower Upper Median Lower 0.7 -31.3 2.8 -0.5 -558 7.5 4.6 -119 1 -107 7.3 -1.8 -310 20.3 12.5 -34.6 9.4 2.5 1.5 52.2 2.5 -2.4 27.7 14 -65.8 Return on Sales % Return on Assets % Return on Net Worth %
Step by Step Solution
There are 3 Steps involved in it

Get step-by-step solutions from verified subject matter experts