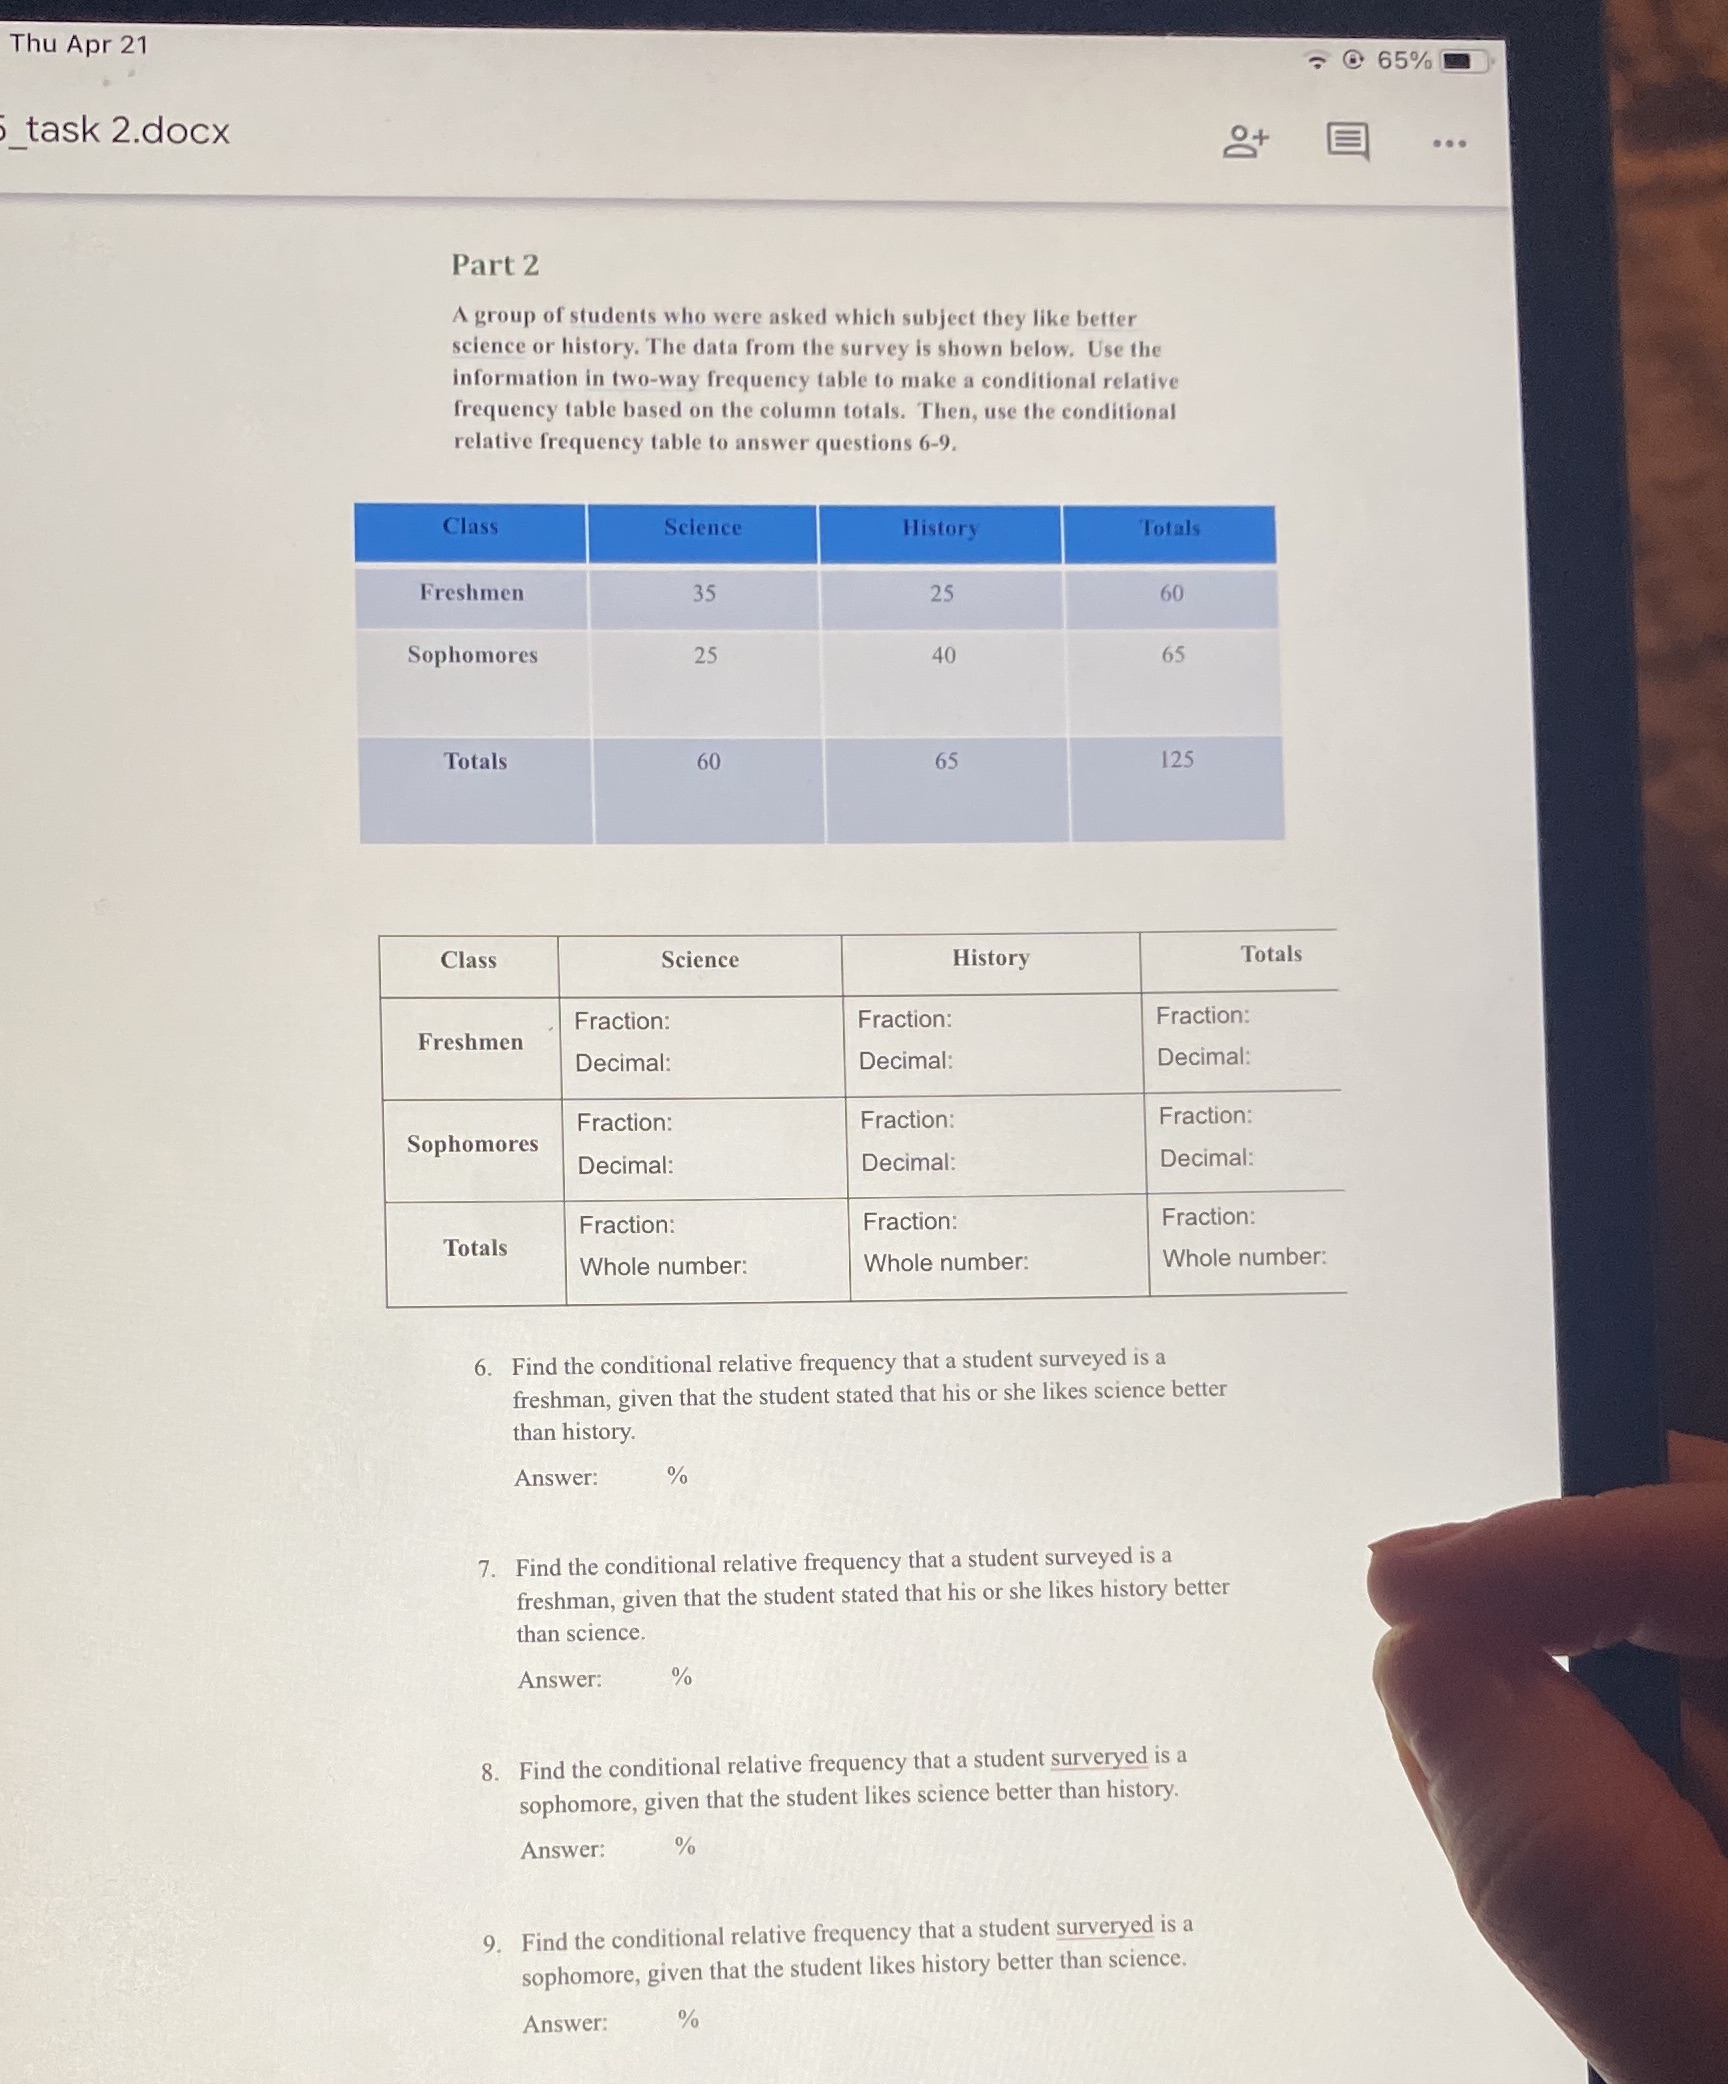
Question: Thu Apr 21 0 65% task 2.docx 8+ . .. Part 2 A group of students who were asked which subject they like better science

Thu Apr 21 0 65% task 2.docx 8+ . .. Part 2 A
Thu Apr 21 0 65% task 2.docx 8+ . .. Part 2 A group of students who were asked which subject they like better science or history. The data from the survey is shown below. Use the information in two-way frequency table to make a conditional relative frequency table based on the column totals. Then, use the conditional relative frequency table to answer questions 6-9. Class Science History Totals Freshmen 35 25 60 Sophomores 25 40 65 Totals 60 65 125 Class Science History Totals Fraction: Fraction: Fraction: Freshmen Decimal: Decimal: Decimal: Fraction: Fraction: Fraction: Sophomores Decimal: Decimal: Decimal: Fraction: Fraction: Fraction: Totals Whole number: Whole number: Whole number: 6. Find the conditional relative frequency that a student surveyed is a freshman, given that the student stated that his or she likes science better than history. Answer: 7. Find the conditional relative frequency that a student surveyed is a freshman, given that the student stated that his or she likes history better than science. Answer: 0% 8. Find the conditional relative frequency that a student surveryed is a sophomore, given that the student likes science better than history. Answer: % 9. Find the conditional relative frequency that a student surveryed is a sophomore, given that the student likes history better than science. Answer: %

Step by Step Solution

There are 3 Steps involved in it

1 Expert Approved Answer
Step: 1 Unlock blur-text-image
Question Has Been Solved by an Expert!

Get step-by-step solutions from verified subject matter experts

Step: 2 Unlock
Step: 3 Unlock

Students Have Also Explored These Related Mathematics Questions!