

Question: Time and vertical position readings from graph At = 0.025 s (timer at 40 Hz) Point # t (s) y (m) Ay (m) v =
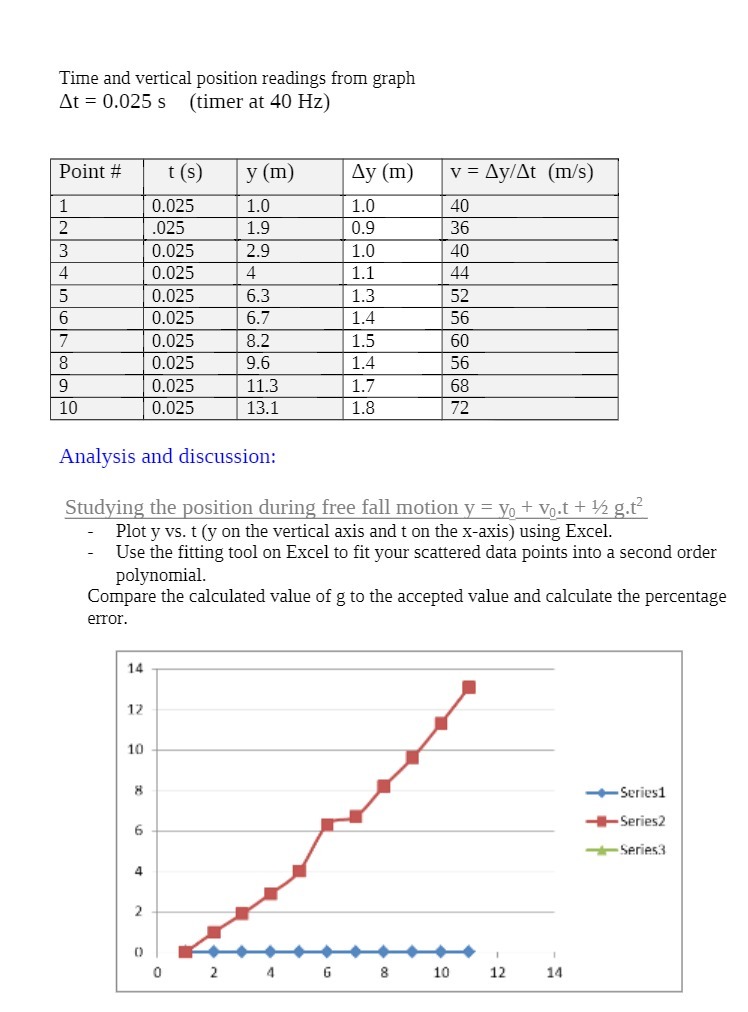
Time and vertical position readings from graph At = 0.025 s (timer at 40 Hz) Point # t (s) y (m) Ay (m) v = Ay/At (m/s) 1 0.025 1.0 1.0 40 2 025 1.9 0.9 36 3 0.025 2.9 1.0 40 4 0.025 4 1.1 44 5 0.025 6.3 1.3 52 6 0.025 6.7 1.4 56 7 0.025 8.2 1.5 60 8 0.025 9.6 1.4 56 9 0.025 11.3 1.7 68 10 0.025 13.1 1.8 72 Analysis and discussion: Studying the position during free fall motion y = yo + Vo.t + 12 g.t Plot y vs. t (y on the vertical axis and t on the x-axis) using Excel. Use the fitting tool on Excel to fit your scattered data points into a second order polynomial. Compare the calculated value of g to the accepted value and calculate the percentage error. 14 17 10 Series1 6 Series2 -Series3 2 G 8 10 12 14
Step by Step Solution
There are 3 Steps involved in it

Get step-by-step solutions from verified subject matter experts