

Question: Time left 0:53: n The frequency distribution table below shows the lengths, in millimeters, measured to the nearest mm, of 45 leaves taken from plants
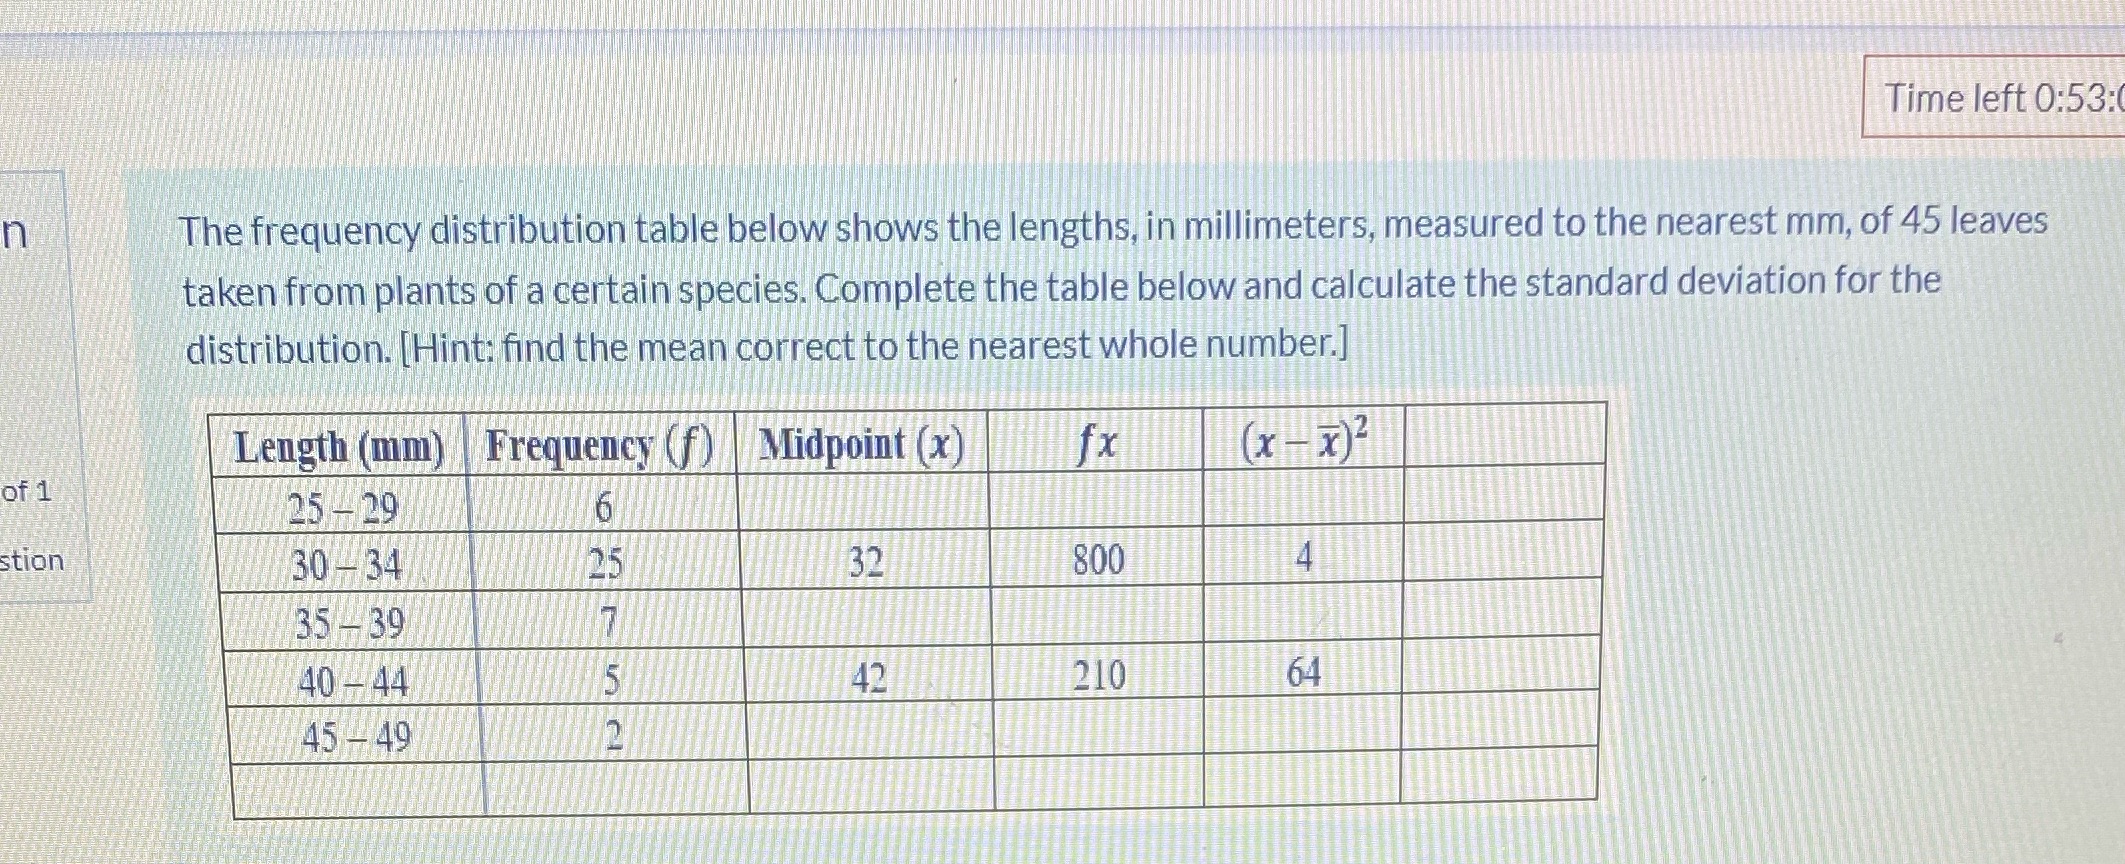
Time left 0:53: n The frequency distribution table below shows the lengths, in millimeters, measured to the nearest mm, of 45 leaves taken from plants of a certain species. Complete the table below and calculate the standard deviation for the distribution. [Hint: find the mean correct to the nearest whole number.] Length (mm) Frequency (F) Midpoint (x) fx (x - x)2 of 1 25 - 29 6 stion 30 - 34 25 32 800 4 35 - 39 7 40 - 44 5 42 210 64 45 -49
Step by Step Solution
There are 3 Steps involved in it
1 Expert Approved Answer
Step: 1 Unlock

Question Has Been Solved by an Expert!
Get step-by-step solutions from verified subject matter experts
Step: 2 Unlock
Step: 3 Unlock