

Question: time (seconds) Write a script to generate the signal values for the figure above corresponding to 200 equally-spaced time values ranging from 0 to 6.
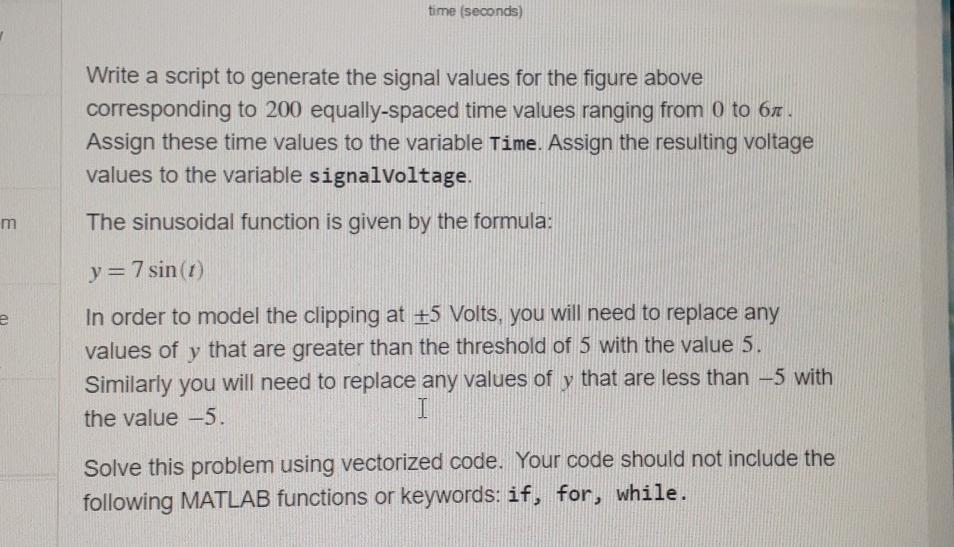
time (seconds) Write a script to generate the signal values for the figure above corresponding to 200 equally-spaced time values ranging from 0 to 6. Assign these time values to the variable Time. Assign the resulting voltage values to the variable signalvoltage. m The sinusoidal function is given by the formula: y=7 sin (1) e In order to model the clipping at +5 Volts, you will need to replace any values of y that are greater than the threshold of 5 with the value 5. Similarly you will need to replace any values of y that are less than -5 with the value -5. Solve this problem using vectorized code. Your code should not include the following MATLAB functions or keywords: if, for, while
Step by Step Solution
There are 3 Steps involved in it

Get step-by-step solutions from verified subject matter experts