

Question: time. Time (sec) 0 1 2 3 4 The chart below gives information on velocity as a function of Velocity (m/s) 0 11.0 19.4
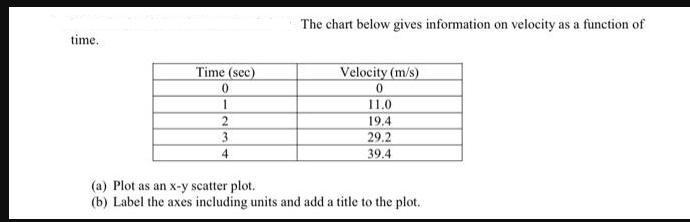
time. Time (sec) 0 1 2 3 4 The chart below gives information on velocity as a function of Velocity (m/s) 0 11.0 19.4 29.2 39.4 (a) Plot as an x-y scatter plot. (b) Label the axes including units and add a title to the plot.
Step by Step Solution
★★★★★
3.50 Rating (163 Votes )
There are 3 Steps involved in it
1 Expert Approved Answer
Step: 1 Unlock

Answer i Step1 ii Method of plotting graph in Excel iii Fi... View full answer
Question Has Been Solved by an Expert!
Get step-by-step solutions from verified subject matter experts
Step: 2 Unlock
Step: 3 Unlock