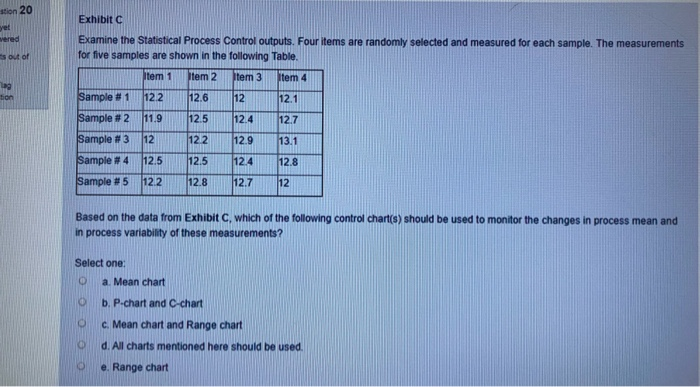
Question: tion 20 yet vered Exhibit C Examine the Statistical Process Control outputs. Four items are randomly selected and measured for each sample. The measurements for

tion 20 yet vered Exhibit C Examine the
tion 20 yet vered Exhibit C Examine the Statistical Process Control outputs. Four items are randomly selected and measured for each sample. The measurements for five samples are shown in the following Table Item 1 Item 2 Item 3 Item 4 s out of tion Sample # 1 12.2 12.6 12 12.1 Sample #2 11.9 12.5 12.4 12.7 Sample #3 12 122 12.9 13.1 Sample #4 12.5 12.5 12.4 12.8 Sample #5 122 12.8 12.7 12 Based on the data from Exhibit C, which of the following control chart(s) should be used to monitor the changes in process mean and in process variability of these measurements? Select one: a. Mean chart b. P-chart and C-chart c. Mean chart and Range chart d. All charts mentioned here should be used e. Range chart

Step by Step Solution

There are 3 Steps involved in it

1 Expert Approved Answer
Step: 1 Unlock blur-text-image
Question Has Been Solved by an Expert!

Get step-by-step solutions from verified subject matter experts

Step: 2 Unlock
Step: 3 Unlock

Students Have Also Explored These Related General Management Questions!