

Question: To achieve the colored and shading effect shown in this heat map, use the options in the menu. FIGURE 2 . 2 3 A Heat
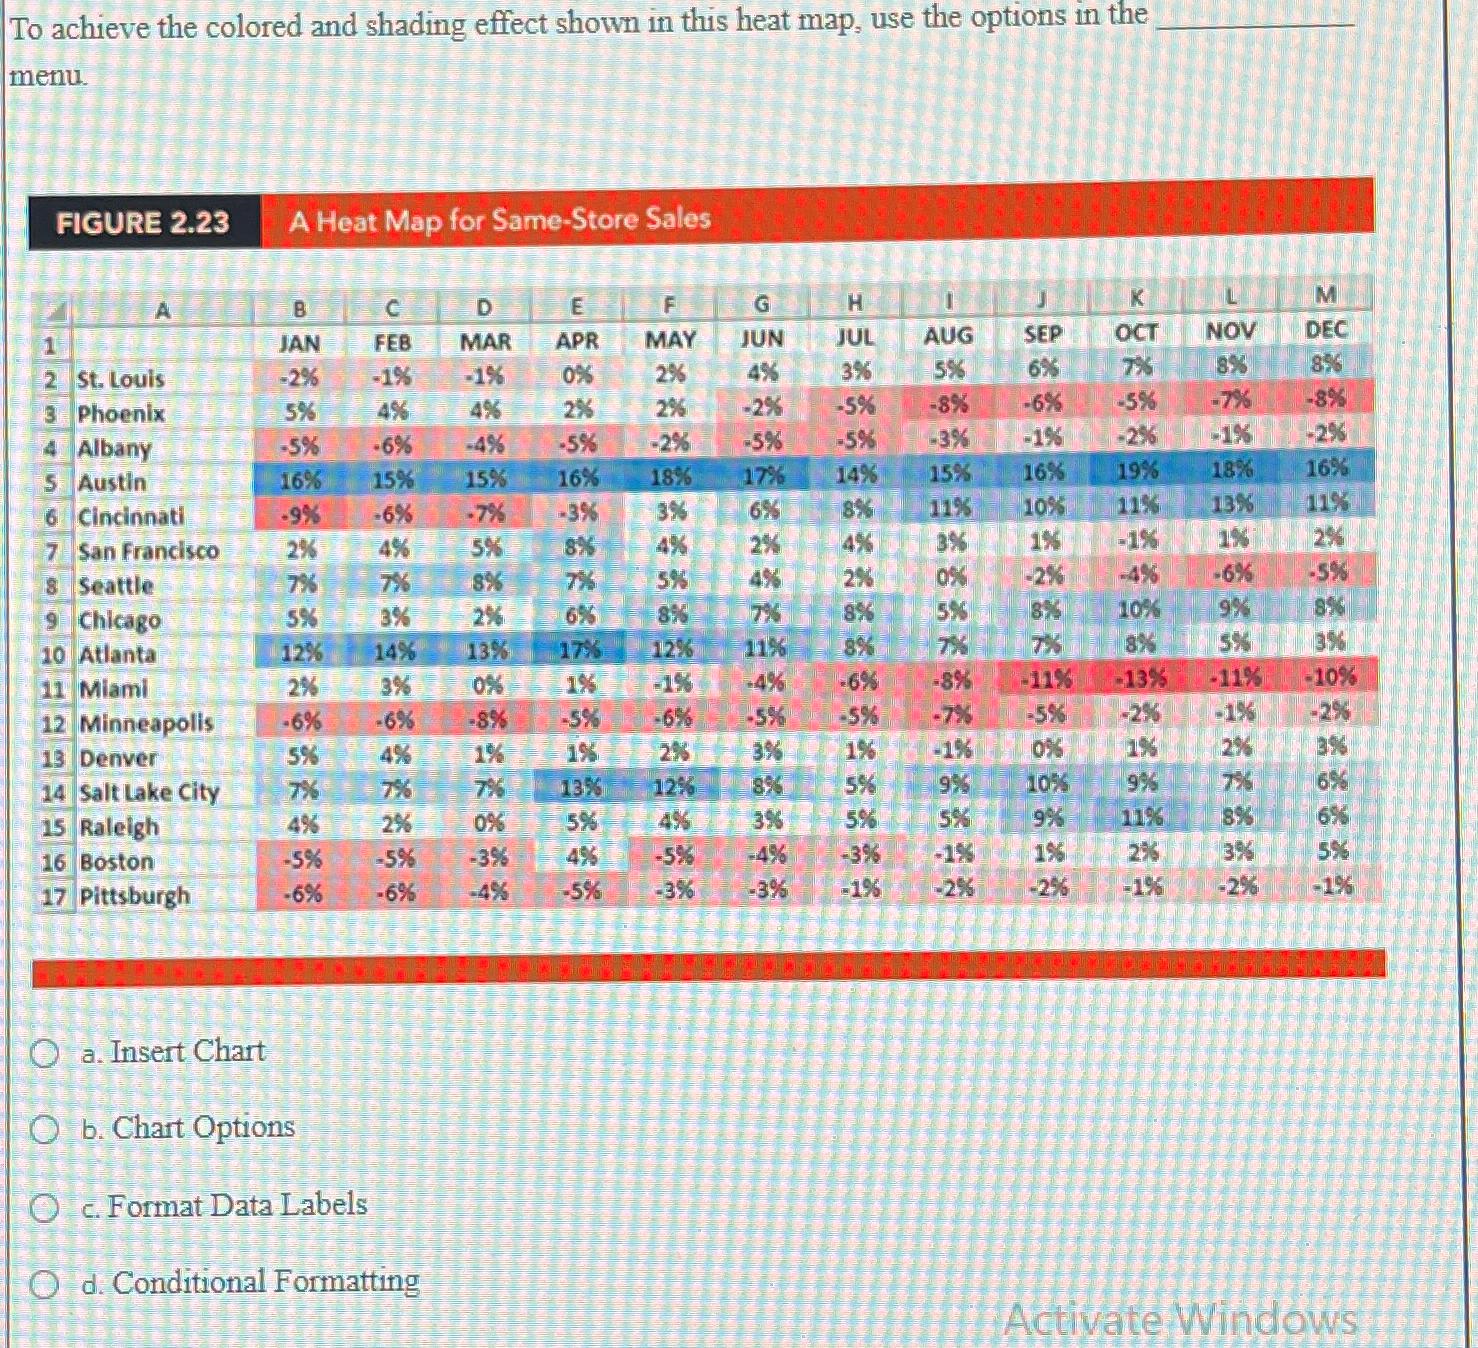
To achieve the colored and shading effect shown in this heat map, use the options in the menu.
FIGURE
A Heat Map for SameStore Sales
tableABCDEFGHKLMJAN,FEB,MAR,APR,MAY,JUN,JUL,AUG,SEP,OCT,NOV,DECSt Louis,
Step by Step Solution
There are 3 Steps involved in it
1 Expert Approved Answer
Step: 1 Unlock

Question Has Been Solved by an Expert!
Get step-by-step solutions from verified subject matter experts
Step: 2 Unlock
Step: 3 Unlock